Carbon Footprint 2019 @ the University of Haifa
Preface
At the University of Haifa, our compass is set towards environmental and social sustainability, in accordance with the UN Sustainable Development Goals (SDGs). The 17 SDGs provide a roadmap for the future of humanity and our planet. We are advancing towards these goals through research, teaching, public engagement, and the management of our operations.
In particular, we strive towards a sustainable management of our facilities, attempting to limit the University’s negative impact on the environment. For example, currently we are the country’s only campus to be recognized as ISO 14001 compliant by the Israel Standards Institute, a certification that ensures we operate strategically in order to reduce carbon emissions; electricity, water, gas, and paper usage; and are committed to green building practices.
Moreover, our facilities serve as a living laboratory for the research of people and the environment, and the geographic area in which we operate – from the mountain (Carmel national park campus), through the city (Downtown Haifa Campus) and into the sea (laboratories along the Mediterranean) – offer unique opportunities for research that advances the SDGs.
In an attempt to further reduce the University of Haifa’s impact on the environment, we have commissioned this assessment of the university’s carbon footprint. The report helps in establishing a baseline that will inform our plans for further reducing our facilities’ emissions.
Executive summary
This report analyzes the carbon footprint of the University of Haifa, identifying the key emission sources and serving as a basis for the identification and implementation of abatement measures, in view to formulate the emissions reductions plan of the University. The analysis was conducted according to the GHG Protocol guidelines – the world’s most widely used greenhouse gas accounting standard – and relates to the carbon footprint of the University of Haifa three campuses (Main campus ( ראשי ), City campus ( דילן והנמל ), Marine Sciences ( חקר הימים והאגמים ) andassociated activities, including dormitories, cafeterias present in the campus, as well as other rented spaces such as post office, bank, etc.The carbon footprint includes direct emissions at the University (associated with the fuel consumption in vehicles and buildings, and the use of refrigerants within the HVAC system) as well as indirect emissions from electricity and water consumption, waste treatment, business travels, staff and student commuting, and emissions associated with the manufacture, transport and provision of key goods and services. Finally, the base year chosen was 2019, as it represents the most recent year for which data was available and which was not impacted by the COVID-19 pandemic, which dramatically altered university operations.
Results
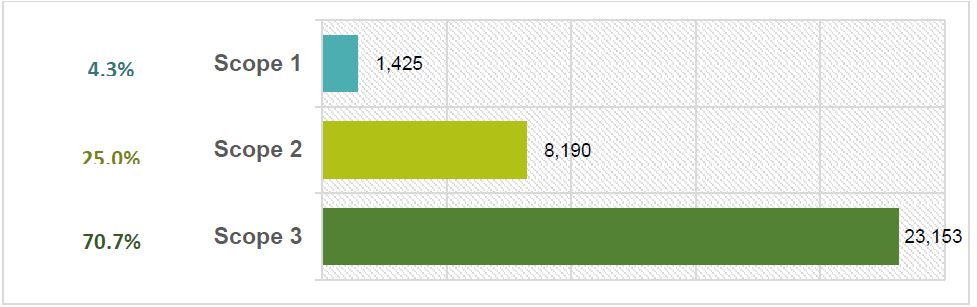
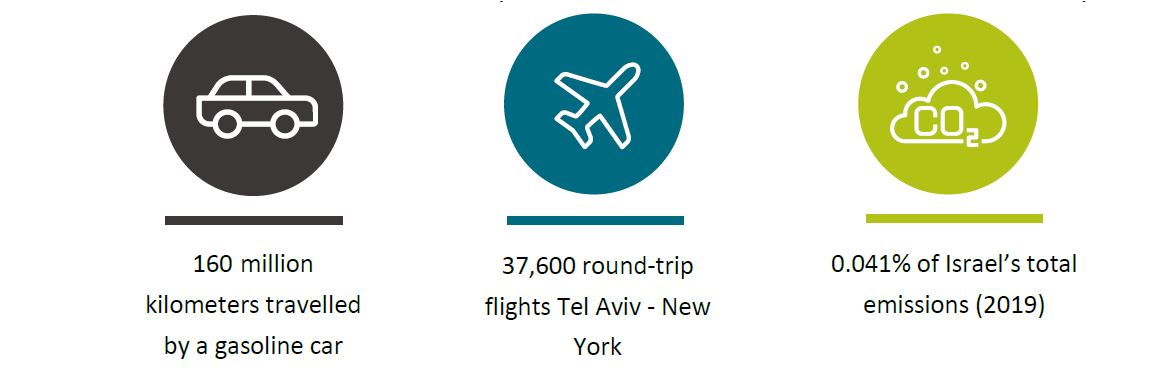
The total 2019 emissions of the University of Haifa amounted to 32,769 tCO2e, which is equivalent to:

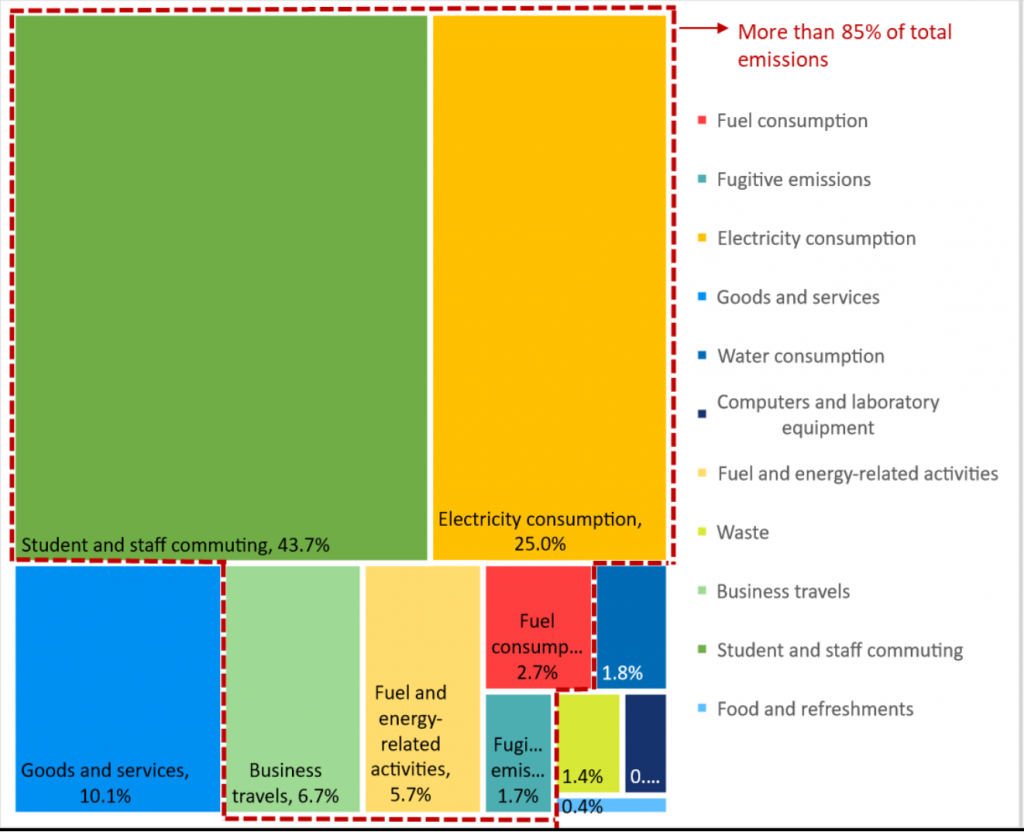
Indirect emissions (scope 3) are the main emission source, representing 70.7% of total university emissions, while other indirect emissions from electricity consumption (scope 2) represented 25%.
i References of equivalence:
- Car: 205 kgCO2e / km / car using gasoline (based on Fuel efficiency 2014, Assessment of Greenhouse Gas Emission Reduction Potential and Recommended National Target for Israel and CBS emission factor)
- Round trip Tel Aviv – New York: 0.871 tCO2e / passenger ((International Civil Aviation Organization (ICAO), no date)
- Israel total emissions in 2019: 79,044,644 tCO2e (CBS, 2021)
1. Student and staff commuting was the main emissions source (43.7% of the total), followed by electricity consumption (25%), and purchase of goods and services (10.1%). Fuel consumption and fuel and-energy related activities combined were responsible of 8.4%.
2. The identification of the main emission sources serves as a basis for formulating emission reduction Mainly, measures to optimize energy consumption and transition to renewable energy will help reduce emissions from electricity consumption, while promoting public transportation for students (and the staff) is crucial to reducing emissions from student commuting, as most of the students are currently assumed to arrive by car.
3. Further analysis of the staff and student commuting is required to provide a more accurate breakdown of modes of transportation and travelled distance (as national and Haifa-specific average values were used respectively for each parameter to estimate the emissions).
4. When comparing the University carbon footprint with 21 other international universities, for which data is publicly available, the University of Haifa is ranked 11th best in emissions per capita, and 12th best in emissions per built area. However, it should be noted that due to differences in data availability and accuracy for various emissions sources, it is difficult to accurately compare emissions between universities.
Analysis overview
Objectives and work process
The main objectives of the carbon footprint study for the University of Haifa were:
1. Calculation of the direct and indirect emissions of the University of Haifa (2019)
2. Identification of key emission sources as a basis for potential emission reduction measures
3. Comparability with other international universities
This study was mandated and overseen by the following Work Team:
- Ofer Arazy, Director of Innovation and Sustainability,
- Alon Assour, Chief Business Development Officer,
- Baruch Marzan, Vice President for Internationalization and Sustainability,
- Aid Rohana, Manager of Data Collection and Analysis, Division of Innovation & Sustainability.
The data collection was conducted through the review of the University’s Energy Survey, as well as through direct data collection. in conjunction with several personnel from the University, most notably:
- Eli Nadiv, Operations Department Director
- Haim Halevi, Director of the Maintenance Unit
Selected standard – GHG Protocol
The carbon footprint of the University of Haifa was conducted following the principles and requirements of the GHG Protocol Corporate Accounting and Reporting Standard (The Greenhouse Gas Protocol, 2011, 2015), which is the world’s most widely-used greenhouse gas accounting standard.ii
The GHG Protocol standard takes into account emissions across the value chain of an organization, a project or a product.
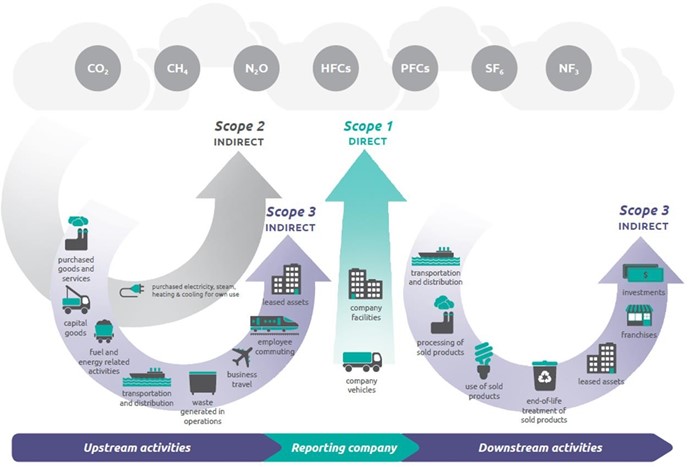
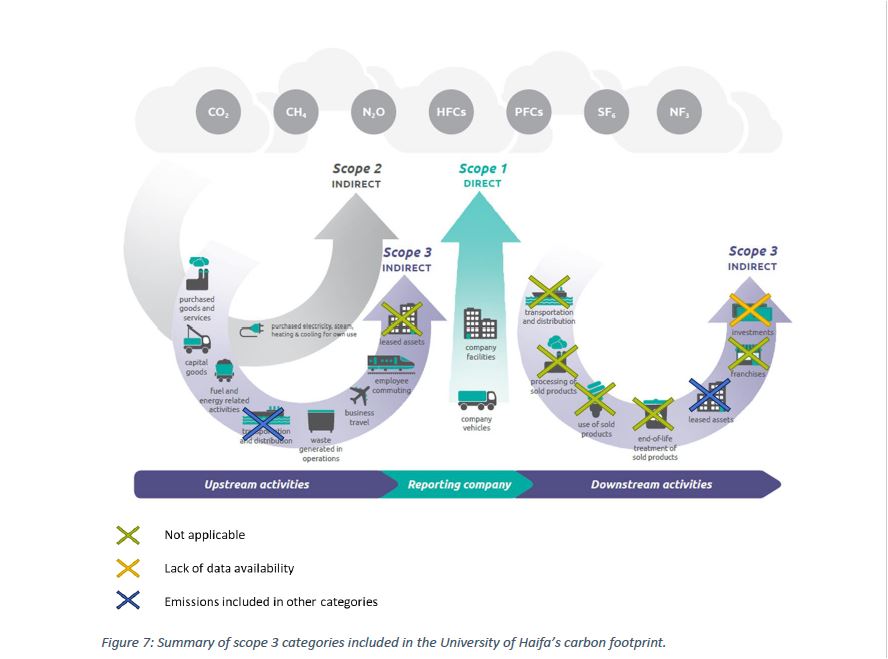
Direct and indirect emissions are categorized into three scopes:
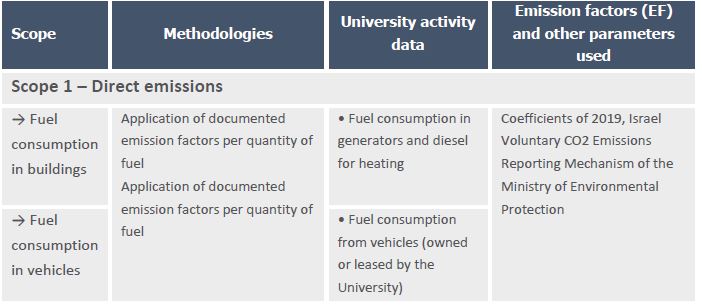
- Scope 1 = Direct GHG emissions
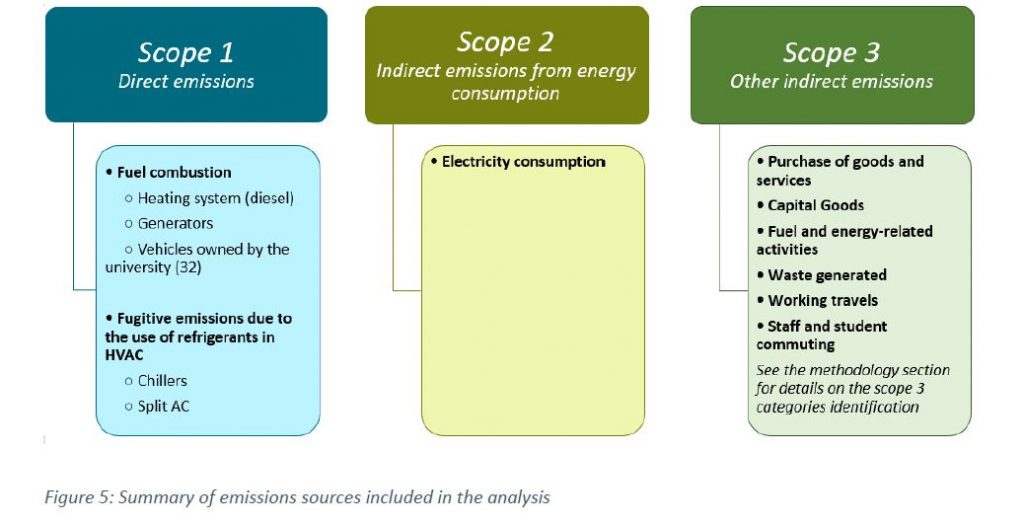
Direct GHG emissions are emissions from sources that are owned or controlled by the organization and include emissions due to fuel consumption (in vehicles, heating equipment or other), and fugitive emissions due to the use of refrigerants in HVAC.
- Scope 2 and 3 = Indirect GHG emissions
ii The Greenhouse Gas Protocol (GHG Protocol) is a multi-stakeholder partnership of businesses, non-governmental organizations (NGOs), governments, and others convened by the World Resources Institute (WRI) and the World Business Council for Sustainable Development (WBCSD). Launched in 1998, the mission of the GHG Protocol is
to develop internationally accepted greenhouse gas (GHG) accounting and reporting standards and tools, and to promote their adoption in order to achieve a low emissions economy worldwide. https://ghgprotocol.org/
iii Source: GHG Protocol
Indirect GHG emissions are emissions that are a consequence of the activities of the organization but occur at sources owned or controlled by another organization. Indirect emissions are divided into two scopes:
→ Scope 2 = Indirect emissions from energy (electricity) consumption
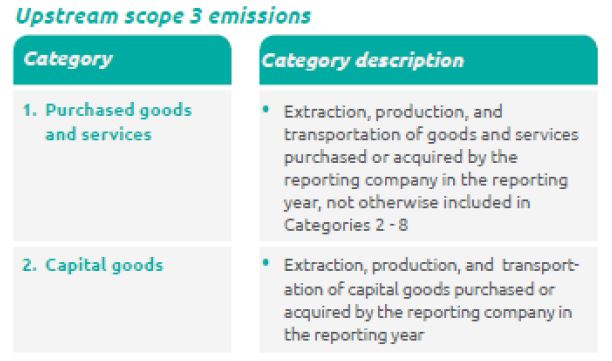
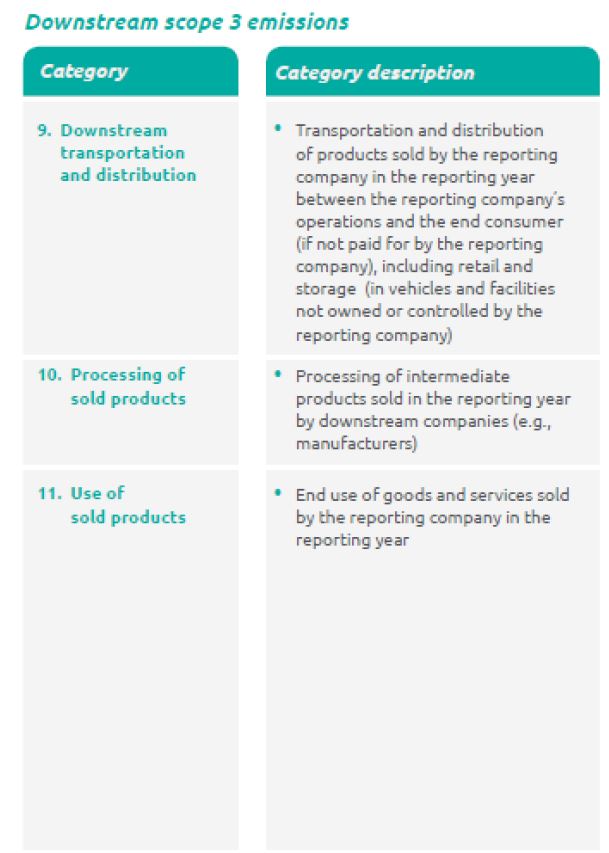
→ Scope 3 = Other indirect emissions (separated into 15 different categories, such as Goods and Services, Waste treatment, Business travel, Students and staff commuting, etc.). Detailed descriptions of each category are provided annex 1.
Boundaries of the analysis
The carbon footprint was performed for all three campuses of the University of Haifa (Main campus (ראשי), City campus (והנמל דילן), Marine Sciences Campus (והאגמים הימים חקר). The first step in performing the carbon footprint is setting the boundaries of the analysis, both in terms of the organizational boundaries, as well as the operational boundaries, as detailed below.
Setting organizational boundaries
In addition to the direct operations of the University, the Haifa campus itself hosts activities by external organizations in its facilities, both on a regular (such as vendors) and an ad-hoc basis. Setting the organizational boundaries essentially determines which activities at the Haifa campus “belong” to the University of Haifa, and which do not.
In setting organizational boundaries, an approach is selected for consolidating GHG emissions. This approach is then consistently applied to define those buildings and operations that constitute the university for the purpose of accounting and reporting GHG emissions.
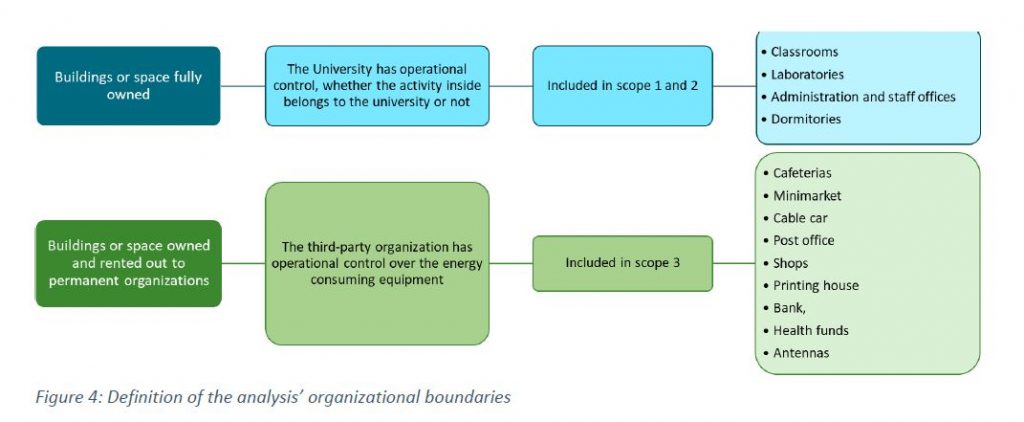
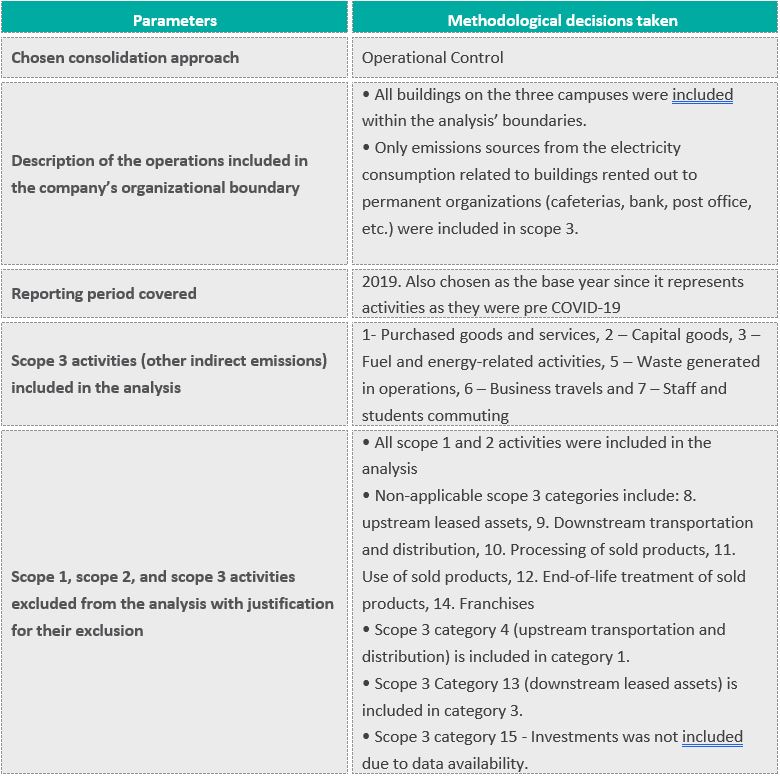
The operational control approach for the University of Haifa’s carbon footprint was selected as the consolidation approach: the analysis included emissions from operations over which the University has operational control, meaning if it has the full authority to introduce and implement its operating policies at the operation. As opposed to financial control, this approach did not account for GHG emissions from operations in which the University owns a financial interest, but does not have operational control; conversely, it includes activities for which the University has operational control despite having no direct financial interest.
Most importantly, this means that emissions associated with activities by external organizations conducted on-campus in the University facilities, such as organizational meetings and events, are included in the University’s organizational boundaries, as it is the University itself that has operational control over these facilities. However, on-campus facilities and activities that are not operated by the University are, to the extent that they provide services to the University, included as indirect emissions (scope 3 – for more detail see operational boundaries below).
Consequently, the boundaries of the analysis considered the following buildings:
Setting operational boundaries
After an organization has determined its organizational boundaries in terms of the operations that it owns or controls, it then sets its operational boundaries. This involves identifying emissions associated with its operations, categorizing them as direct and indirect emissions, and choosing the scope of accounting and reporting for indirect emissions.
What is classified as direct and indirect emissions is dependent on the consolidation approach selected previously for setting the organizational boundary.
Consequently, the following emissions sources were included in the analysis:
Finally, the base year chosen was 2019, as it represents the most recent year for which data was available and was not impacted by the COVID-19 pandemic, which altered university operations.
Methodologies and data used
Scope 1 and 2
In general, high-quality activity data was available at the University level for scope 1 and 2, and the associated emissions factors were University- and Israel-specific.
Therefore, for these scopes, the carbon footprint was conducted using the University’s activity-specific data, as follows:
iv Do not include the upstream emissions or the emissions related to T&D losses; such emissions are calculated in scope 3 – category “Fuel- and Energy-Related Activities”.
Scope 3
As mentioned previously, Scope 3 can be divided into 15 categories. However, categories might not all be relevant and GHG Protocol Scope 3 standard gives flexibility on whether and how to account for scope 3 emissions.
Identification of the applicable categories
The following categories were included in the carbon footprint under scope 3, as they are relevant to the
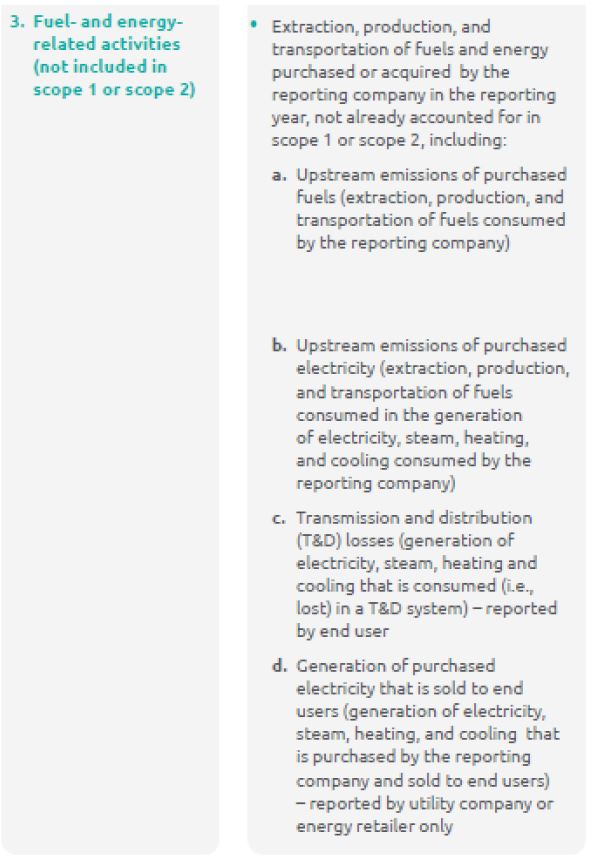
University’s activities: Categories 1- Purchased goods and services, 2 – Capital goods, 3 – Fuel and energyrelated
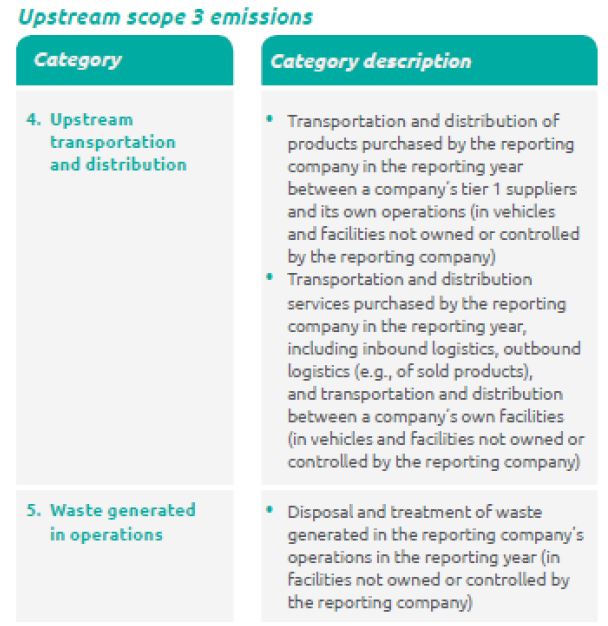
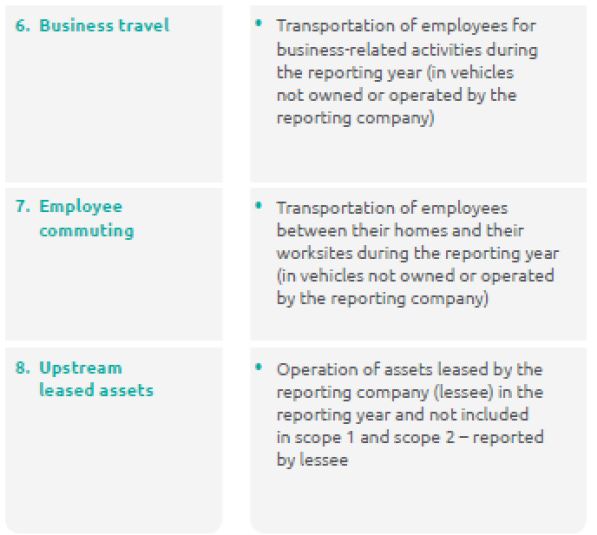
activities, 5 – Waste generated in operations, 6 – Business travels and 7 – Staff and students
commuting.
Although relevant, categories 4 – Upstream transportation and distribution, 13 – Downstream leased assets and 15 – Investments were not included in the final analysis for the following reasons:
- Category 4 (Upstream transportation and distribution) is included in Category 1 (Purchased goods and services), as a sub-category of type of services necessary for the good functioning of the
- In the case of the University of Haifa and according to the standard requirements, Category 13 (downstream leased assets) shall include scope 1 and 2 emissions of leased buildings, namely cafeterias, minimarket, shops, printing house, bank, post office, health funds, However, fuel consumption and refrigerants data were not fully available.
Therefore, in order to avoid double counting emissions from electricity consumption (data available) were included in category 3 (Fuel- and energy- related activities) as “electricity purchased and sold” by the University.
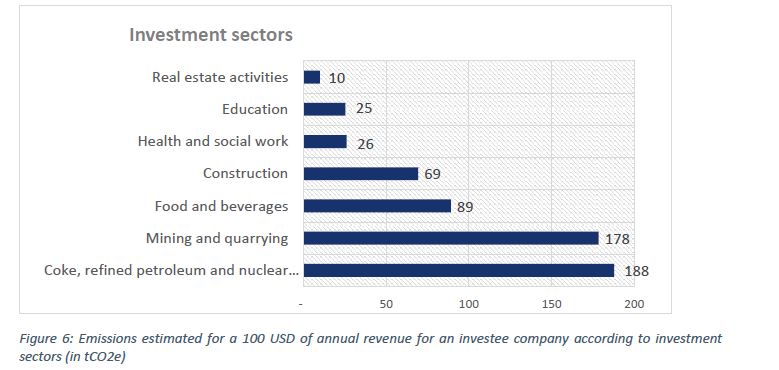
Due to the complexity of obtaining detailed data regarding investments, the corresponding category (category 15) was not included in this The importance of investments within the carbon footprint depends ultimately on the size of the university investment portfolios, the types of companies invested in, and the share of equity that is hold. Investment decisions can have a significant impact on the emissions portfolios, as every 100 USD of annual revenue for an investee company in fossil and nuclear fuel activities would emit 19 more times than a 100 USD of annual revenue for an investee company in real estate activities (See graph below).
This estimation was conducted using the GHG Protocol “Scope 3 evaluator” online toolv which combines financial data with an Environmentally Extended Input Output (EEIO) analysis.
Other categories were considered as not applicable.vi
As a result, categories included in the analysis are the following:
v https://ghgprotocol.org/scope-3-evaluator
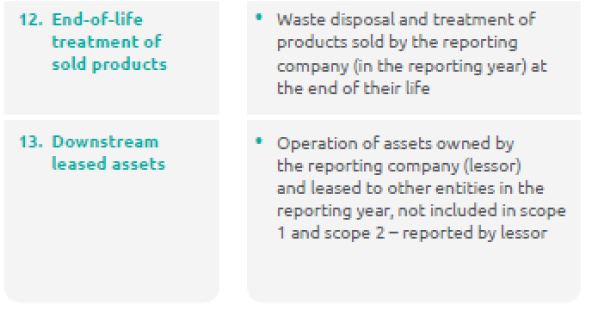
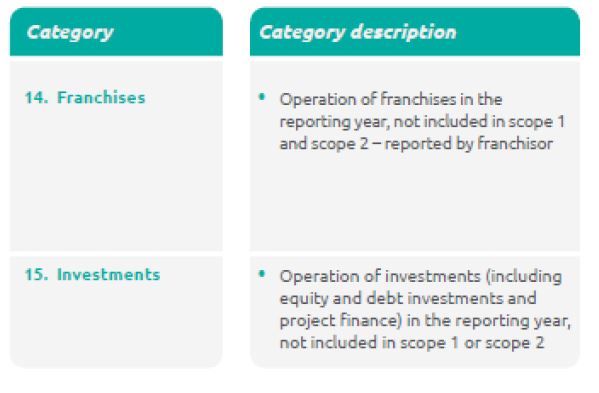
vi Non-applicable categories include: 4. Upstream transportation and distribution, 8. upstream leased assets, 9. Downstream transportation and distribution, 10. Processing of sold products, 11. Use of sold products, 12. End-of- life treatment of sold products, 14. Franchises.
Prioritization of data collection
Data collection efforts were prioritized on specific scope 3 activities. Collecting higher quality data for priority activities allows to focus resources on the most significant GHG emissions in the value chain, more effectively set reduction targets, and track and demonstrate GHG reductions over time.
A combination of approaches and criteria to identify priority activities was used. Broadly speaking, higher quality data was sought for all:
- Activities where more accurate data can be easily obtained.
- Activities that are significant in size
- Activities where the university can potentially reduce emissions.
- Activities that were deemed critical by the Steering Committee, such as food.
- Activities that were included in other universities’ carbon footprint, in order to be able to compare the results between one another. Key activities included in other universities’ carbon footprints are student and staff commuting, business travels, waste generation, and purchases of office supply and detergents (see Chapter “Comparison with other universities”).
For activities that were expected to have insignificant emissions or where accurate data was not available in a timely manner, broader, less site-specific approaches were used to estimate emissions.
Consequently, methodological decisions were taken for each category based on the following decision tree:
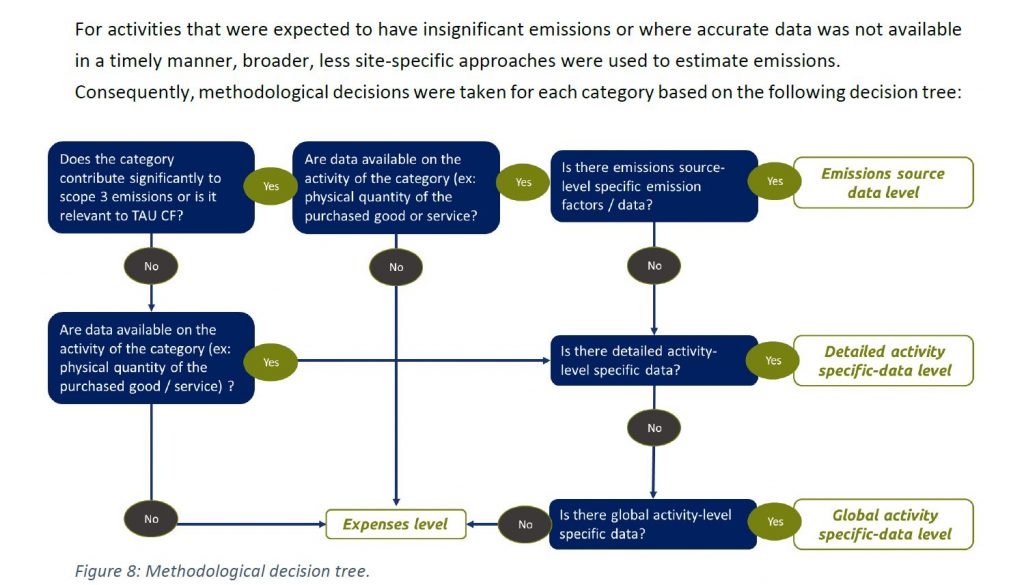
The specific methods applied under each level are as follows, in order of how site-specific the resulting emissions calculation is:
- Emissions source data level, which requires collection of emissions factors directly from the emissions source.
- Supplier-specific This method collects product-level cradle-to-gate GHG inventory data from goods or services suppliers or fuel providers.
- Detailed activity specific level, which requires collection detailed activity data from the Depending on the category, it can correspond to the following method:
- Average-data method. This method was applied to some sub-categories of “Goods and services purchases”, and “Fuel- and Energy-Related Activities” categories. It estimates emissions for goods and services by collecting data on relevant physical units of goods or services purchased (e.g. kilograms, liter) and multiplying by the relevant secondary (e.g., industry average) emission
- Waste-type specific method. As the name indicates, this method applies to the waste category and involves using emission factors for specific waste types and waste treatment
- Distance-based method. Relevant for “Business travels”, this method involves determining the distance and mode of business trips, and applying appropriate emission factors for the modes used.
- General activity-specific level, which requires data relevant to the University’s activities but based on national-level data. This level was only used for student and staff commuting – and is based on the “average-data method” using national commuting
- Expenses level, based on the spend-based method, emissions are estimated by collecting data on the economic value of goods and services purchased and multiplying it by relevant secondary emission factors. This method is relevant only to “Goods and services purchases”, “Capital goods” and part of “Business travel” categories.
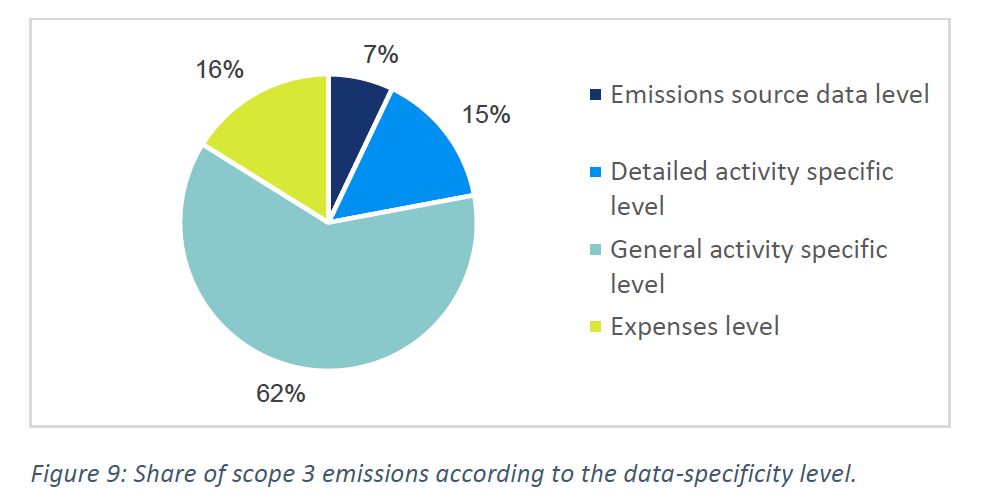
7% of the total scope 3 emissions (corresponding to the campus water consumption and the electricity consumption of third parties) were estimated based on the highest level of data specificity, i.e. collecting data at the emissions source level, and a further 15% were estimated based on detailed activity-specific data.
Only 16% were estimated based on the University’s expenses, the lowest level of data specificity.
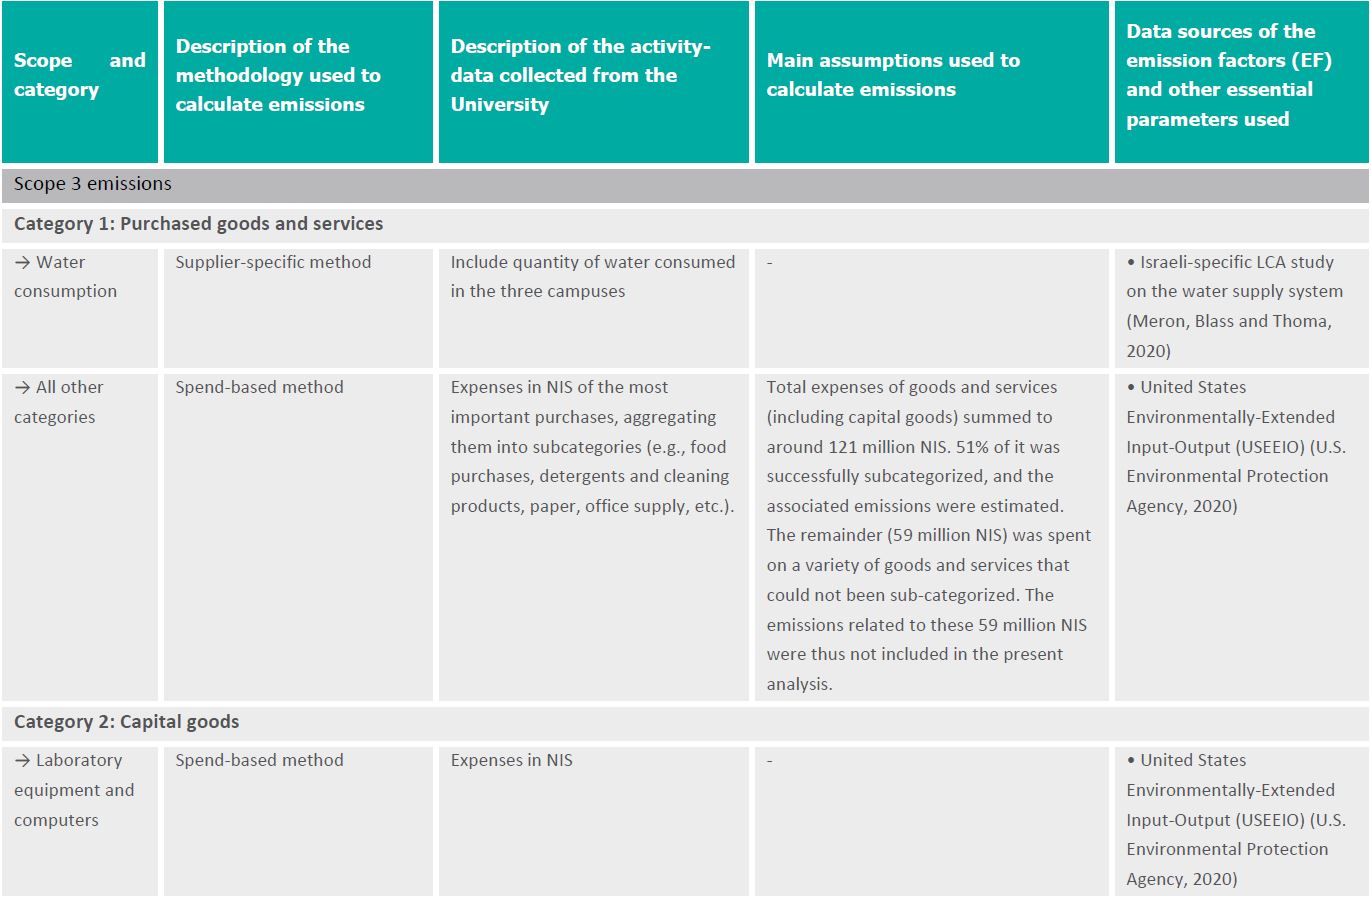
Detailed methodologies and data description related to scope 3 are provided in the following table.
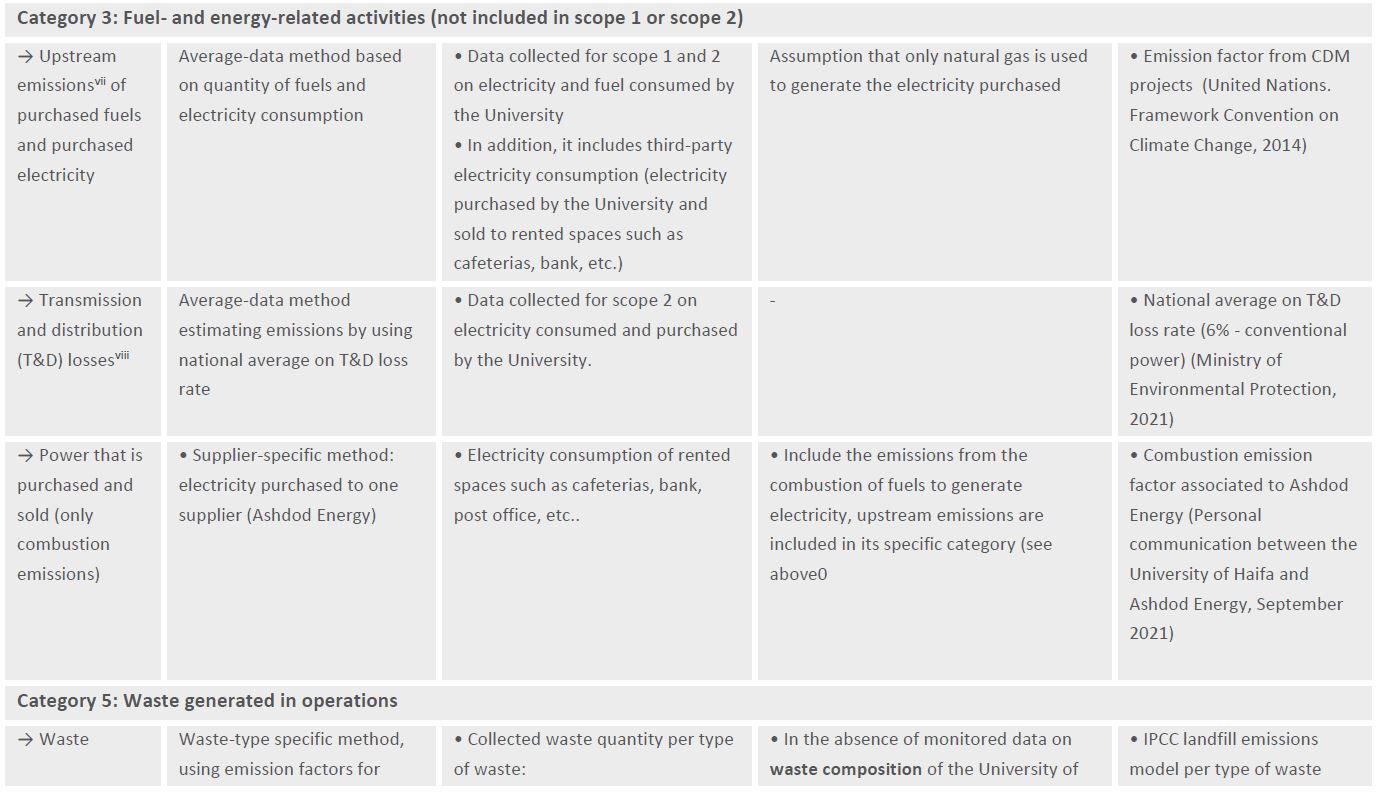
vii Emissions related to the extraction, production, and transportation of fuels purchased directly by the University or of fuels consumed in the generation of electricity that is purchased by the University, Emissions from fuels combustion to generate the electricity are accounted in scope 2.
viii Emissions related to generation (upstream activities and combustion) of electricity reported by the University
Summary of methodological decisions
Main decisions impacting the analysis are summarized in the following table:
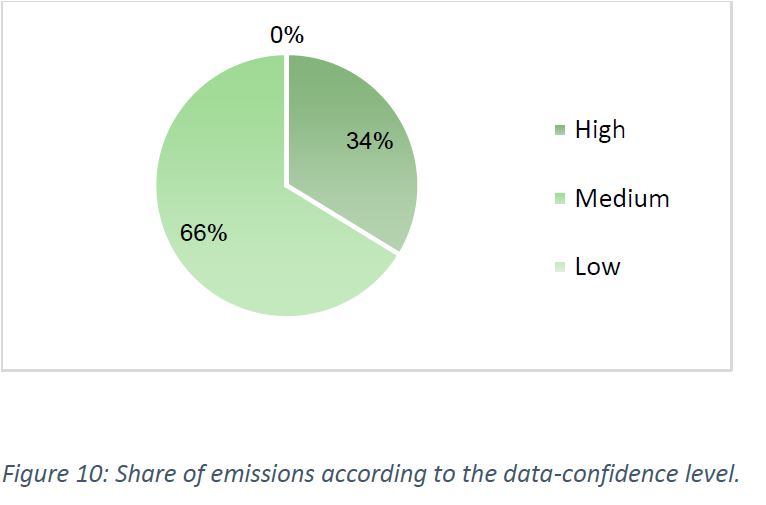
Data confidence:
Data were ranked according three levels of confidence:
- High-confidence: activity data monitored and site/supplier-specific emission factor
- Medium confidence: activity data monitored, but the emission factor applied was not site/supplier-specific, or the activity data was estimated but the emission factor was site/supplier- specific
- Low confidence: activity data estimated and non-site/supplier specific emission
43% of total emissions were estimated based on high-confidence data, which includes:
- Fuel consumption (scope 1): actual fuel consumption was collected, and specific emission factor for each fuel were used;
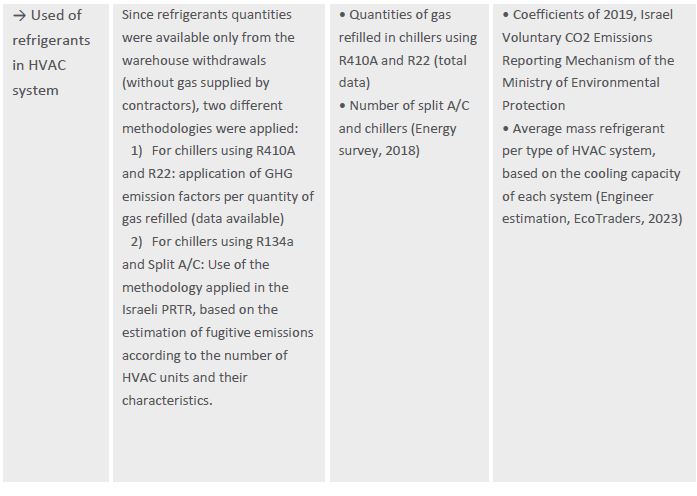
- Consumption of refrigerants in chillers using R410A and R22: activity data was sourced through the warehouse inventory, while emission factors were specific to each
- Scope 2 emissions: electricity consumption was read from electricity meter, and the emission factor used is specific to the University electricity supplier, Ashdod
- Water consumption in scope 3;
- Power that is purchased and sold in scope 3;
57 % of total emissions were estimated based on medium-confidence data:
- Consumption of refrigerants in chillers using R134A and in split AC units which were based on the number of units (sourced from the Energy Survey), with the mass of refrigerants estimated based on the cooling capacity and the average value of gas per cooling capacity (expert estimation).
- Remainder of scope 3 categories.
No data was ranked with a low confidence.
Results confidence:
Emissions were calculating via an Excel tool and subject to a dual QA/QC process:
- One technical, conducted by a fellow project manager who reviewed all the formulas, data relations, conversions,
- One from a final results point of view, conducted by the team manager who reviewed the logic of the results in terms of scale, or comparison with similar projects.
Results
Total emissions
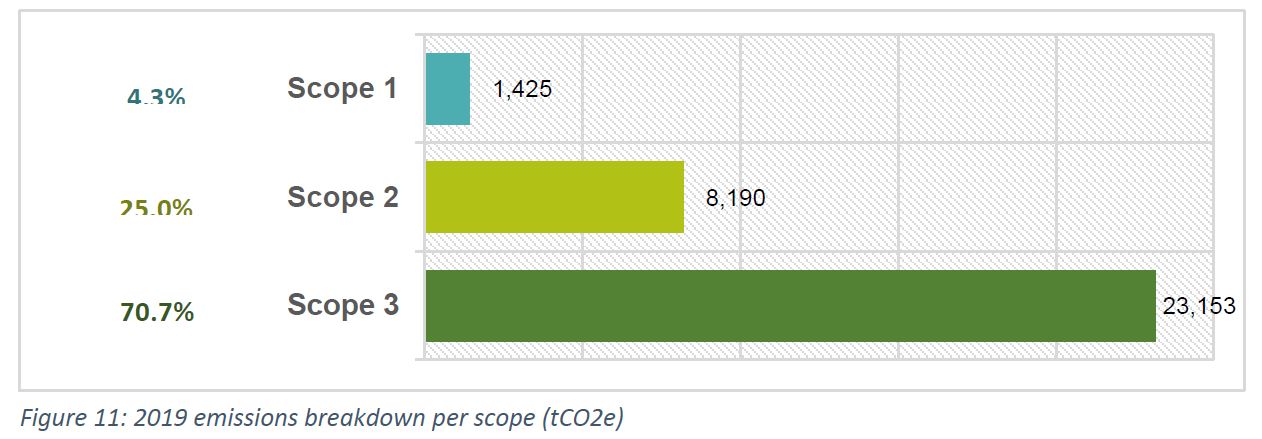
In 2019, the University of Haifa emitted a total of 32,769 tCO2e.
Other indirect emissions (scope 3) was the main emission category, representing 70.7% of total emissions from the University, while indirect emissions from electricity consumption (scope 2) represented 25%. Direct emissions due to fuel consumption and the use of refrigerants in the HVAC system constituted only 4.3% of total emissions.
With 17,353 students and 2,333 staff members (faculty and administrators) the emissions amounted to 1.7 tCO2e / capita.
When considering the total gross constructed buildings’ area, equal to 175,479 m2, the University emitted 0.187 tCO2 per square meter.
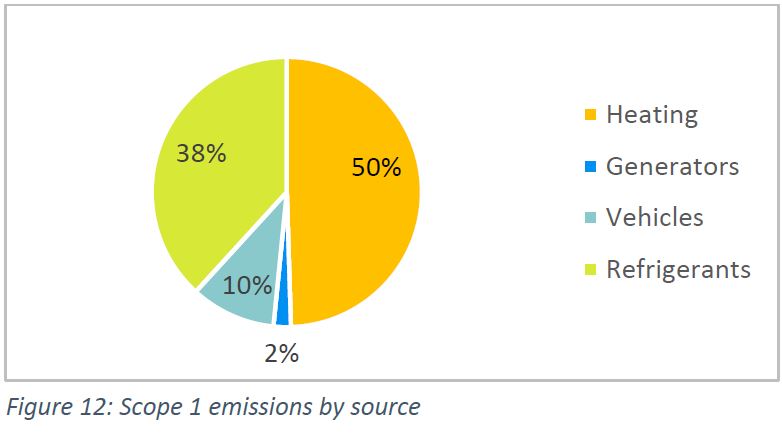
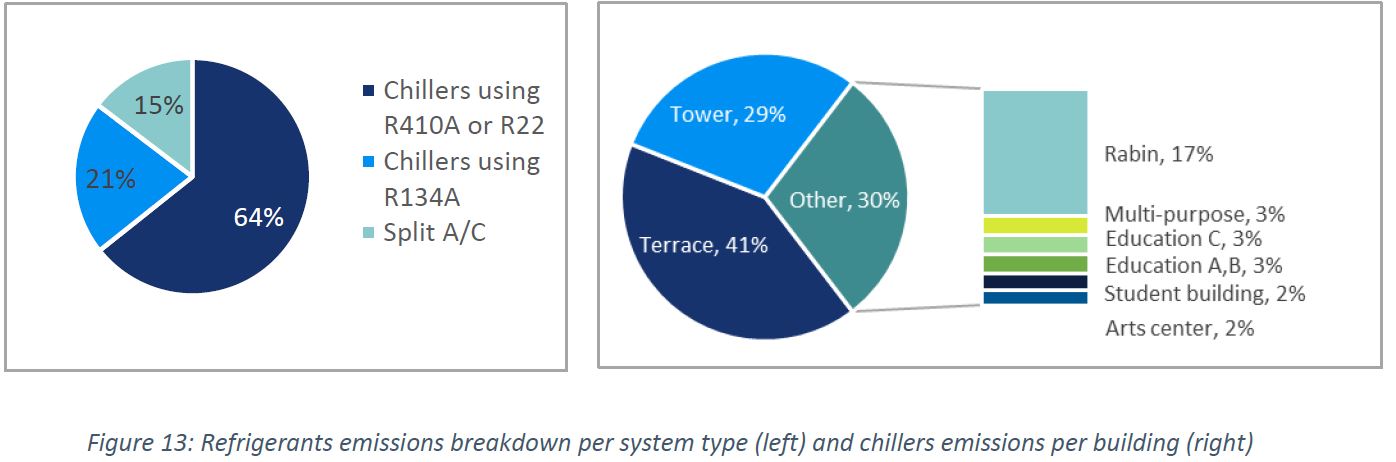
Scope 1 – Direct emissions
Scope 1 emissions = 1,425 tCO2e, representing 4.3% of total emissions.
Direct emissions were mainly due to the use of diesel for heating (50% of direct emissions), which is used only in three buildings: the Main building (ראשי), Migdal (מגדל), and Rabin (רבין).
The use of refrigerants in the University’s HVAC systems (gas used for the air-conditioning of the buildings – R410A, R22 or R134A) was responsible for 38%. According to the repartition of the chiller’s units indicated in the Energy Survey, emissions from such system mainly occur in the Rabin, Tower and Terrace buildings.
Emissions from fuel consumption in vehicles owned and leased by the University (32 vehicles in total) represented 10% of direct emissions, while generators, used only for emergencies, represented only 2%.
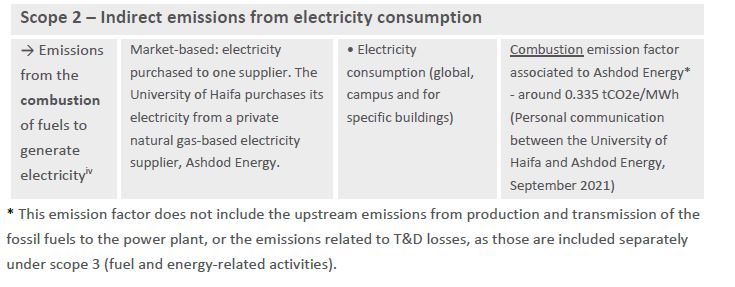
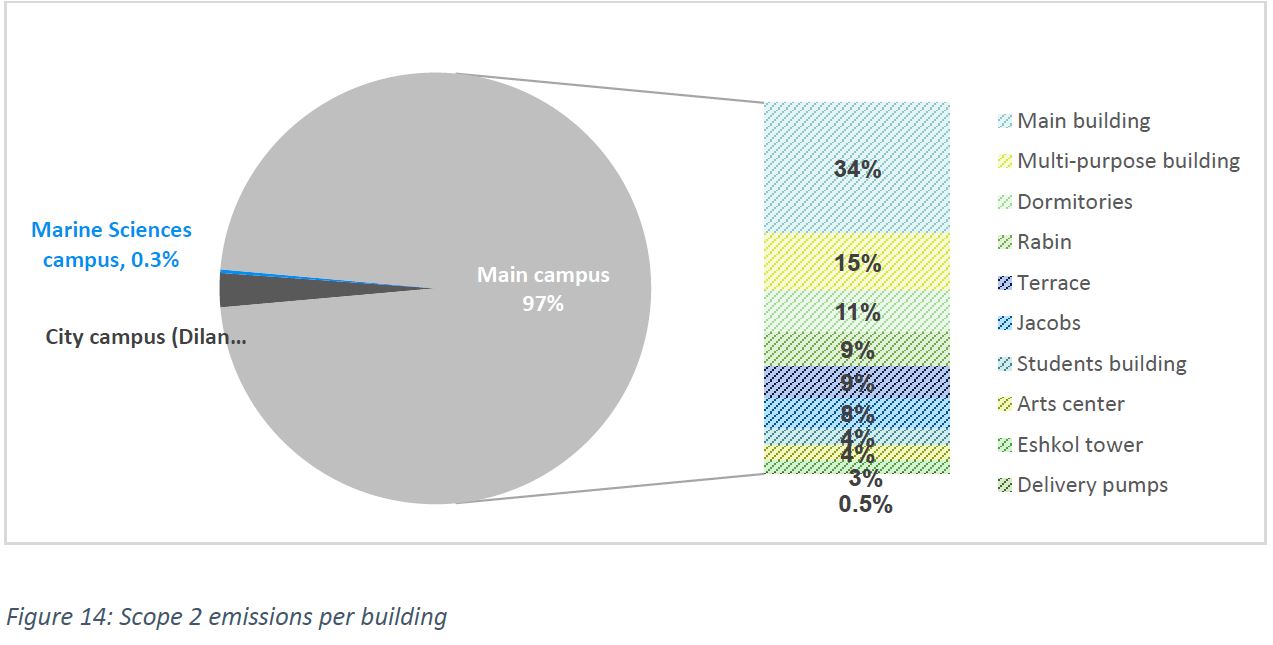
Scope 2 – Indirect emissions from electricity consumption
Scope 2 emissions = 8,190 tCO2e, representing 25% of total emissions
The University of Haifa purchases its electricity from a private natural gas-based electricity supplier, Ashdod Energy.9
According to the breakdown of electricity consumption by building, the primary source of emissions due to electricity consumption occurs in the Main Building (34%), followed by the “multipurpose” building ( רב תכליתי) (15%) and the dormitories (11%).
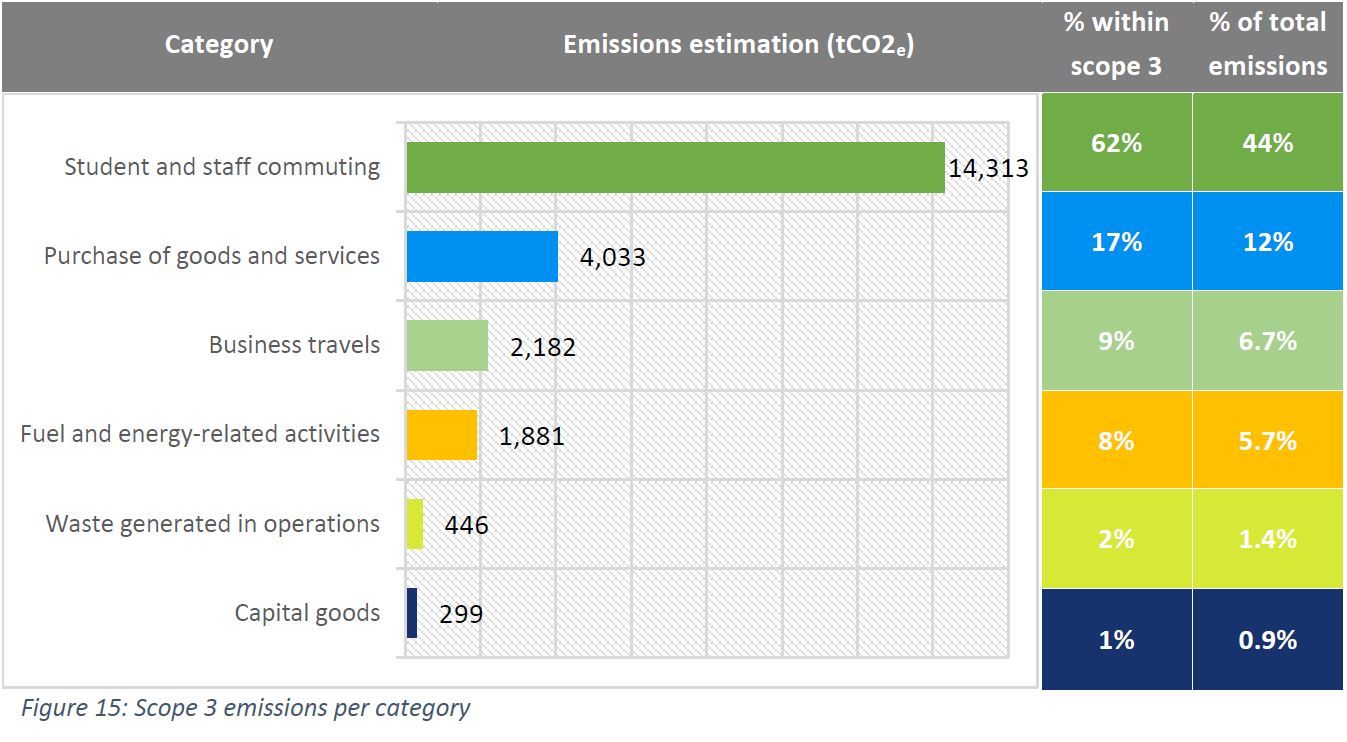
Scope 3 – Other indirect emissions
Scope 3 emissions = 23,153 tCO2e, representing 70.7% of total emissions
Student and staff commuting is the main indirect emission source. Purchase of goods and services, is second, followed by business travels.
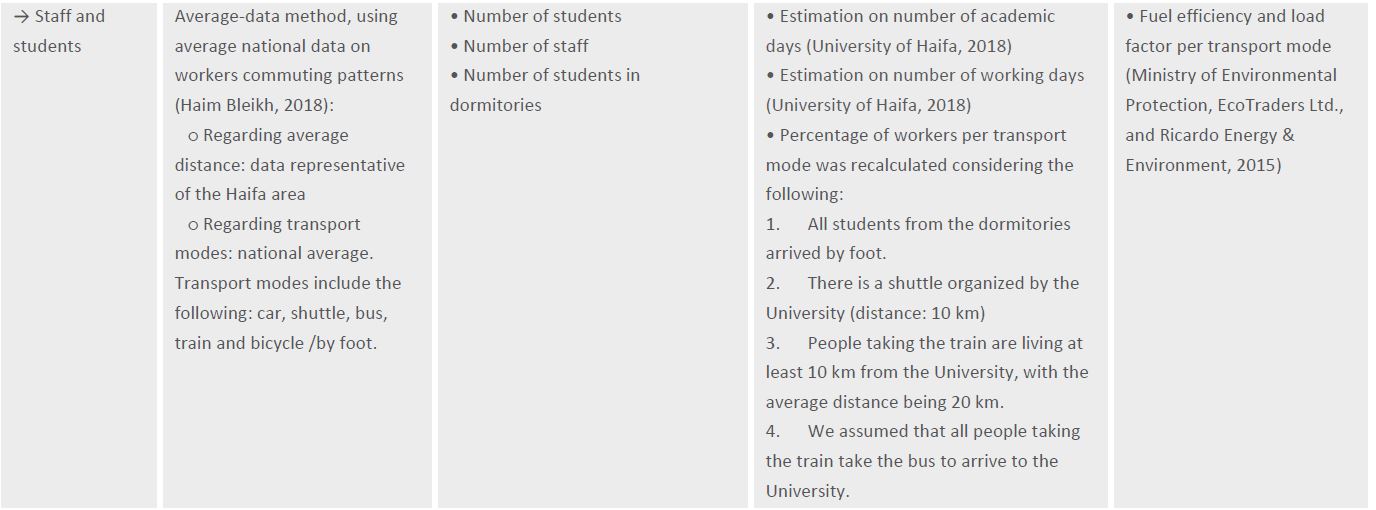
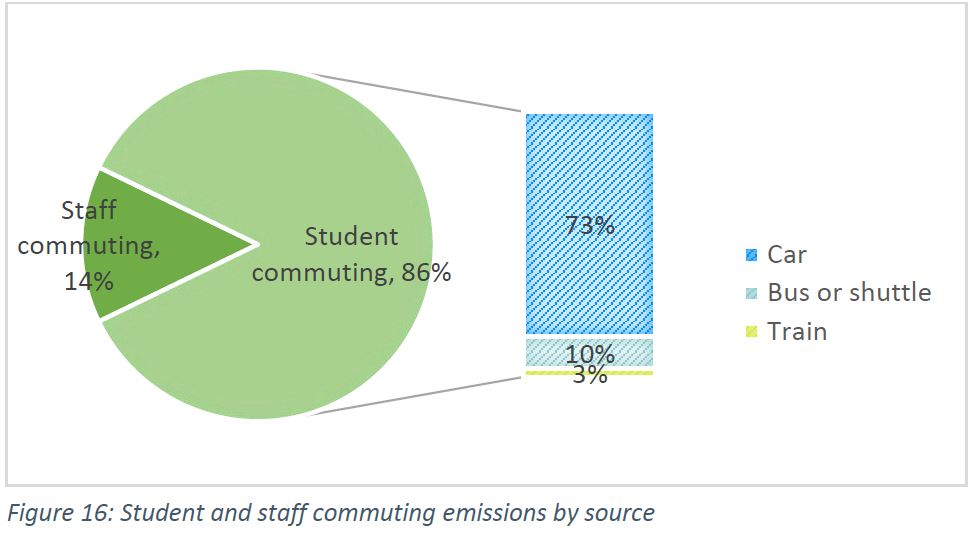
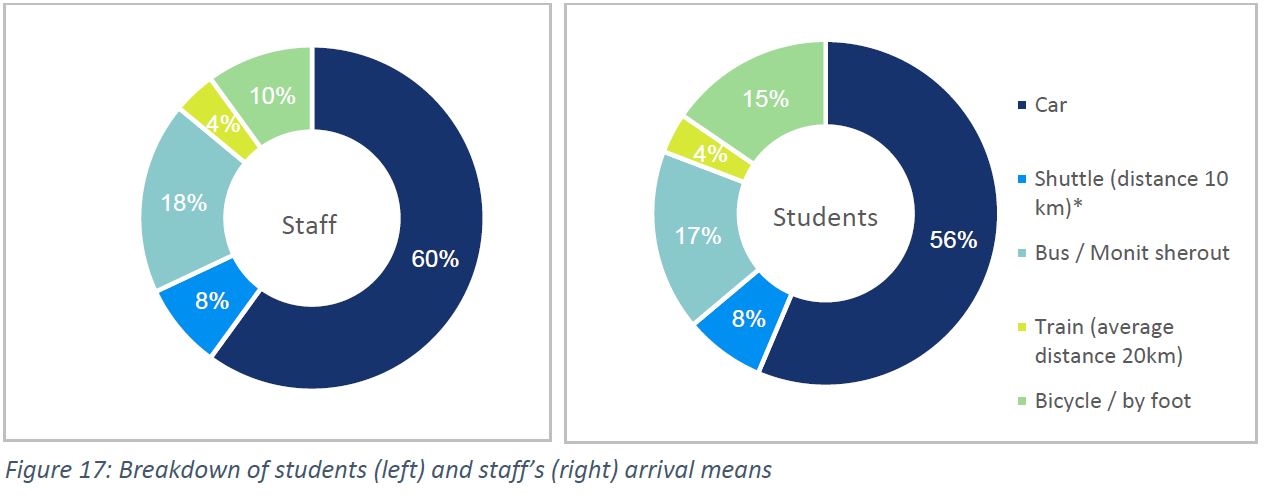
Student and staff commuting
Represent 44% of total emissions
In the absence of monitored data (such as an employee and student transportation survey), national data on employee commuting by transportation mode was used in combination with Haifa-specific data on commuting distances to estimate total annual person-kilometers travelled by staff and students by mode as a basis for the emissions calculation.
Consequently, 60% of the 2,333 staff were assumed to arrive by car; 56% of the 17,353 students were assumed to arrive by car, due to the fact that the national and Haifa-specific data were only applied to the 94% of the student body that do not reside in the dormitories. The 6% of the students that do reside in the dormitories were assumed to arrive by foot.
Student commuting represents three quarters of the commuting emissions. Taking into account that on average, a student arriving by car emits around 3.5 times as much as a student arriving by bus or by train, they emit 85% of the emissions associated with student commuting emissions.
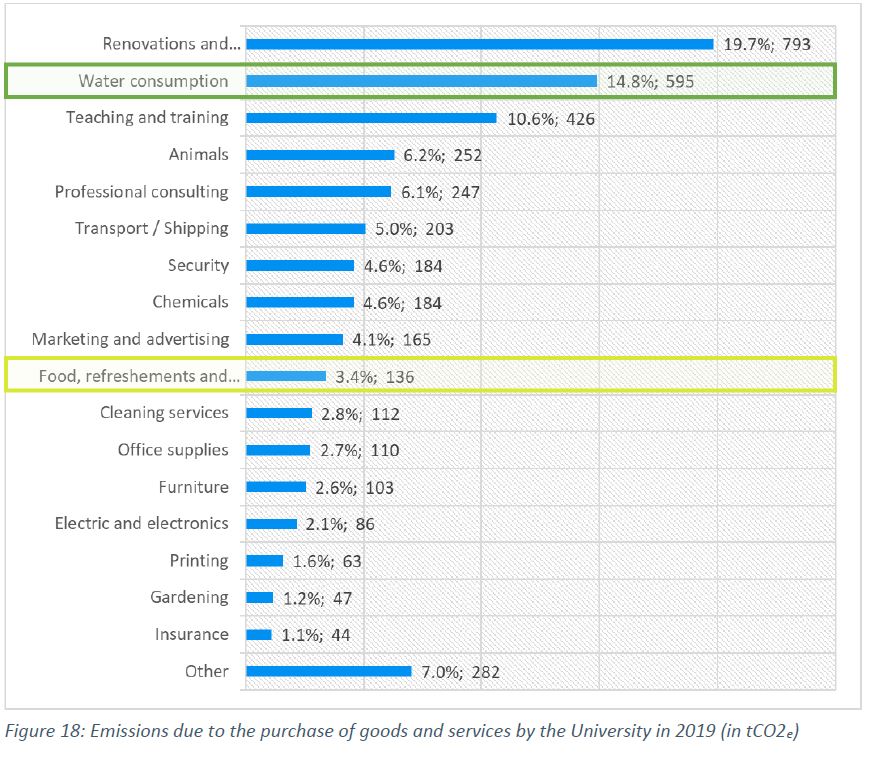
Purchase of goods and services
Represents 12% of total emissions.
The breakdown of emissions from the purchase of goods and services by category is presented in the graph below.
Renovation and maintenance were responsible for around 20% of the emissions in this category, followed by water consumption (15%), teaching and training activities (11%), purchase of laboratory animals (mainly mice and flies) and professional consulting (6% each). The “other” category includes all the categories that are less than 1% of emissions from the purchase of “goods and services” while the remaining categories represent less than 5% each.
All categories apart from “water consumption” were calculated using the spend-based method. The expenses related to these categories totaled 62 million NIS.
It should be noted that an additional 59 million NIS were spent on a variety of goods and services that could not been sub-categorized further. Consequently, the emissions related to these additional purchases were not included in the present analysis.
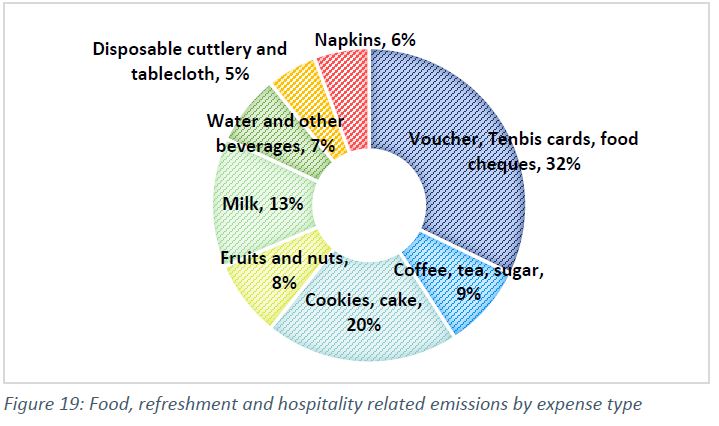
Expenses related to food purchase and refreshments totaled only 3.4% of this category emissions, with 32% of the emissions due to the purchase of food cheques, vouchers or “Tenbis” cards (32%). It should be noted that for this type of expense, a general emission factor associated to “Food and beverage and tobacco products” was used.
Disposable cutlery and tablecloth were responsible for only 5% of the food and refreshments emissions.
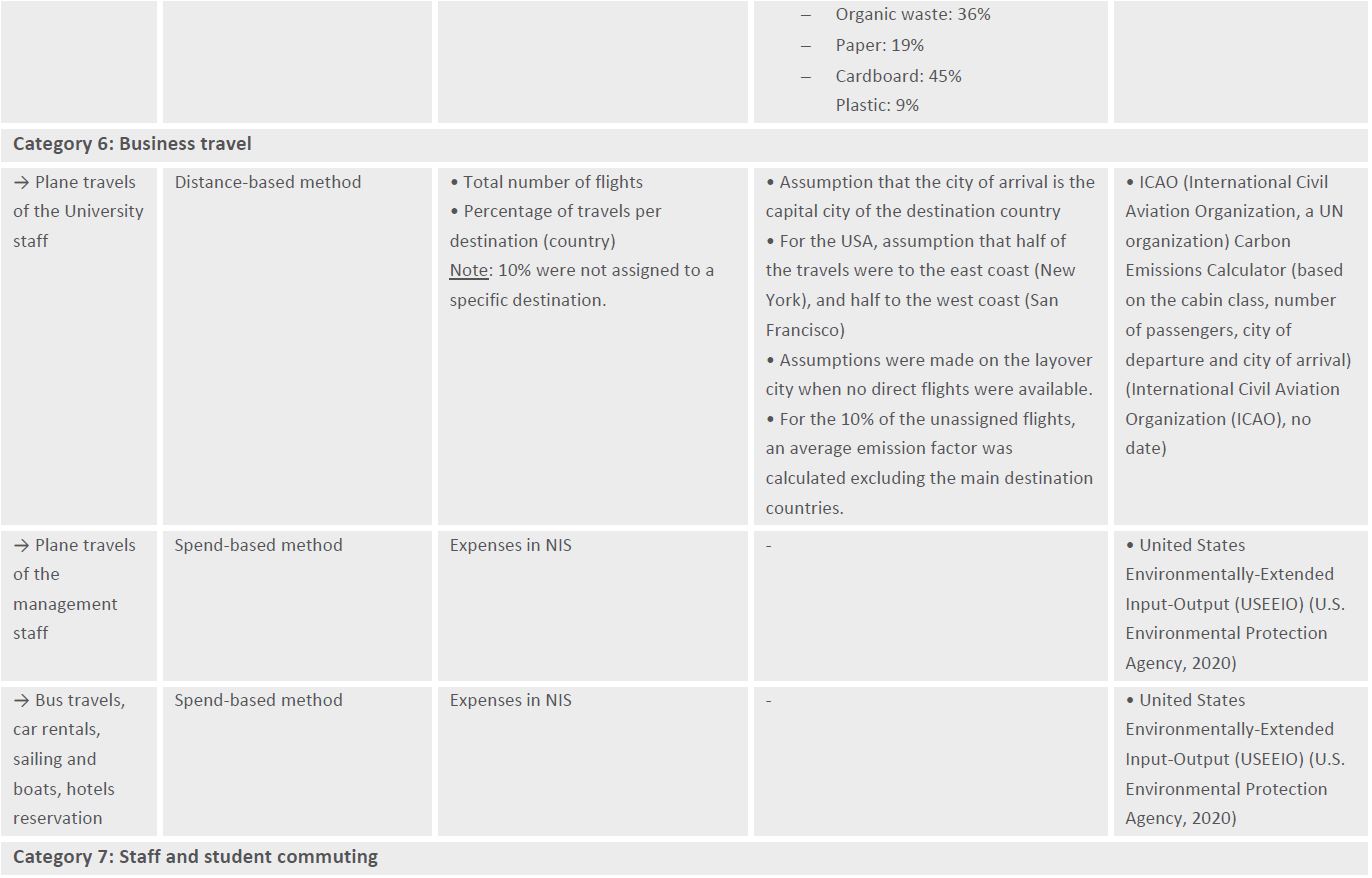
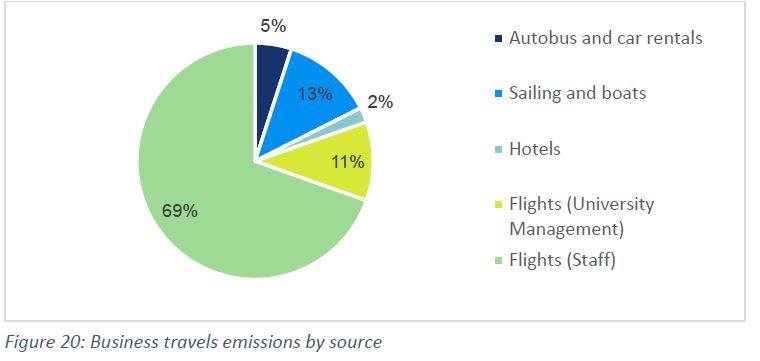
Business travels
Represent 6.7% of total emissions
Flights are the main source of emissions in the business travels’ category, accounting for 80% of emissions. It should be noted that only flights from the staff are calculated with a distance-based method, the rest is based on the spend-based method.
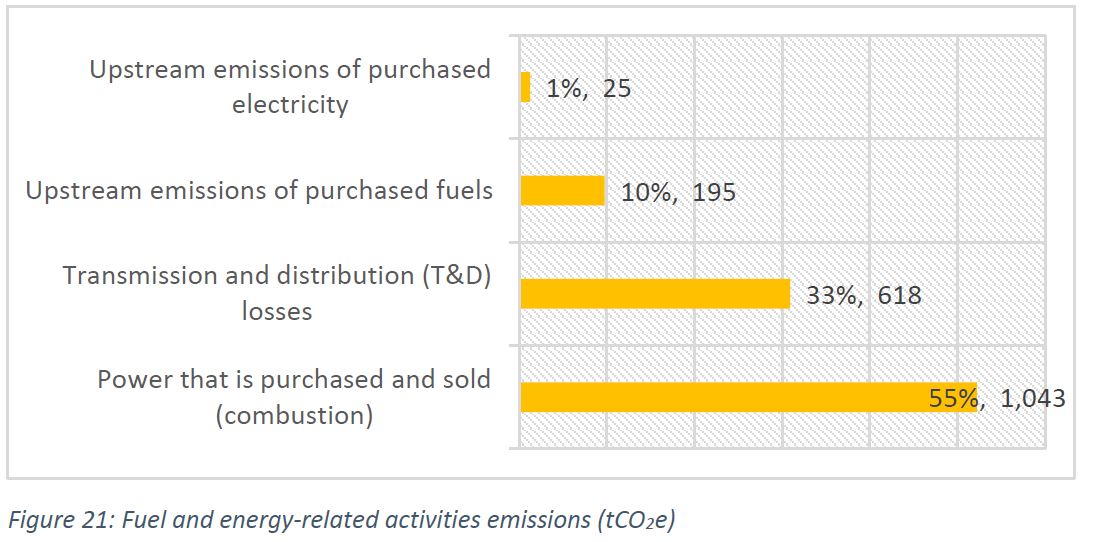
Fuel and energy-related activities
Represent 5.7% of total emissions
Fuel and energy-related activities emissions (not included in scope 1 or scope 2) encompass the emissions related to the production of fuels and energy purchased and consumed by the University.
These emissions are divided into four sub-categories. Power that is purchased and sold (emissions due to fuel combustion to generate the electricity) is the main source (55%), followed by emissions due to transmission and distribution losses (34%).
In 2019, total electricity purchased and sold amounted to 3,117,269 kWh, and relates to the electricity consumed by the cafeterias, minimarket, shops, printing house, bank, post office, health funds, or antennas present on campus.
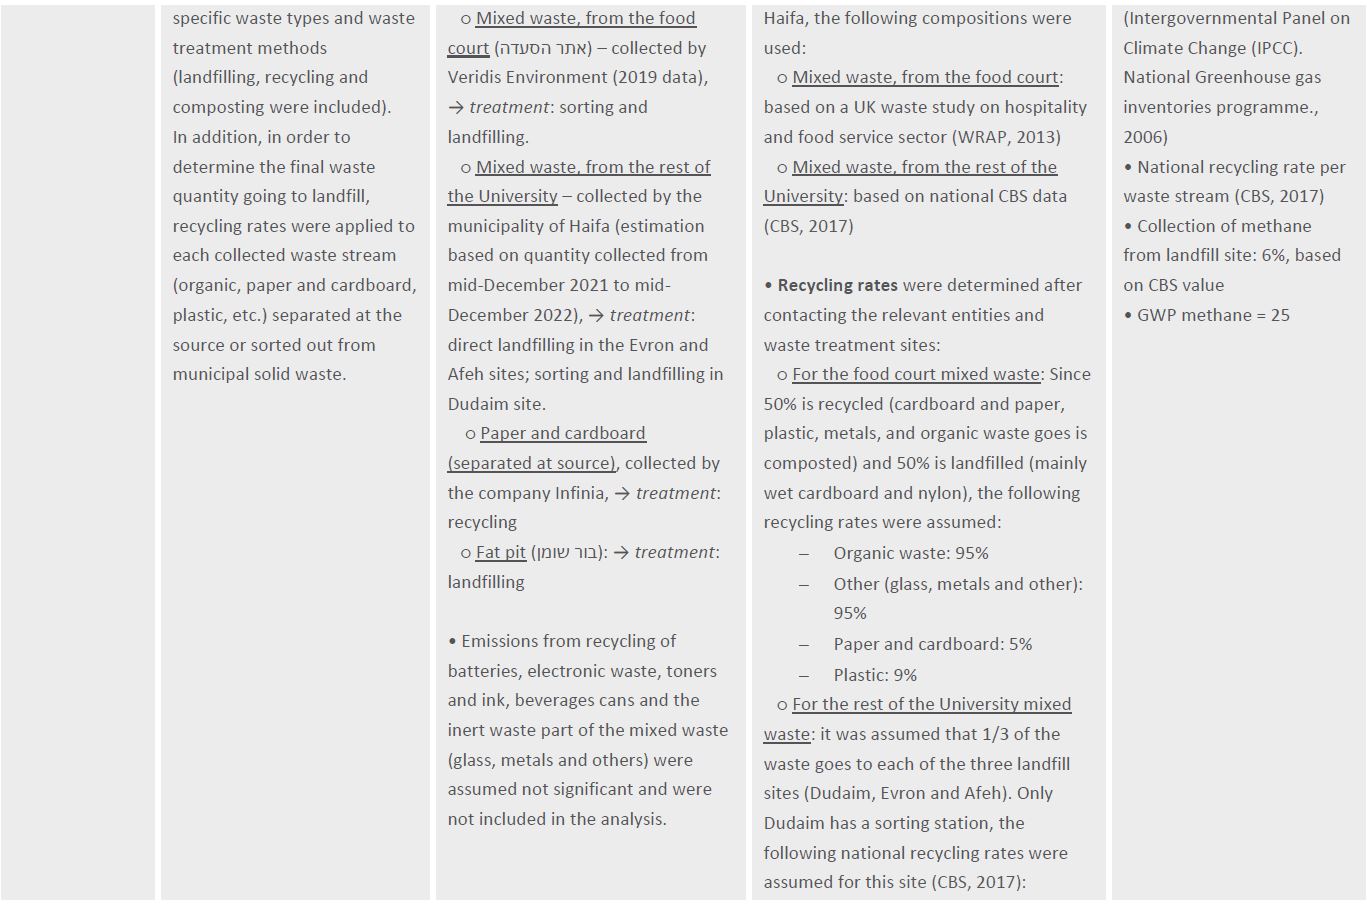
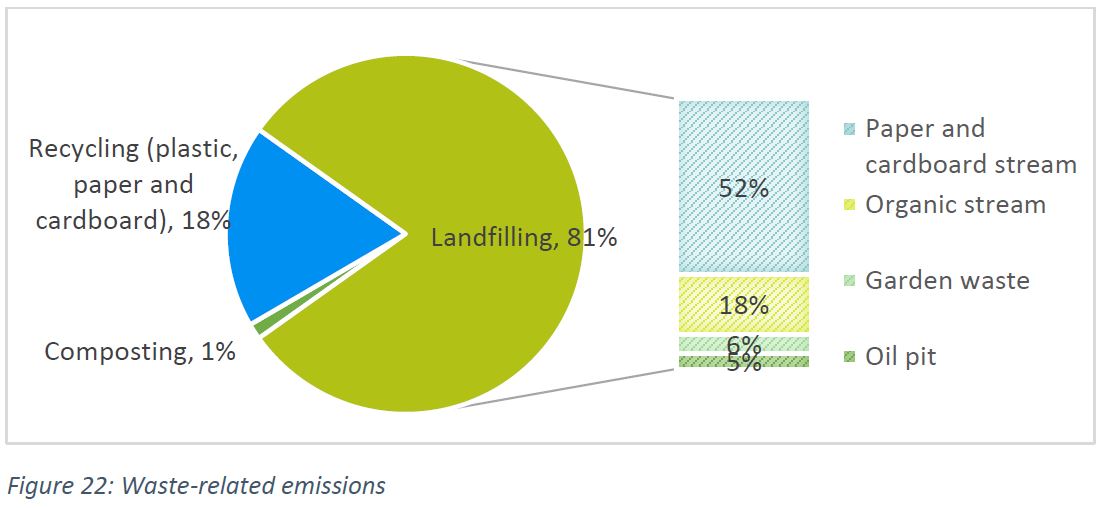
Waste
Represent 1.4 % of total emissions
Waste emissions are mainly due to the landfilling of mixed waste that was not separated at the source. Indeed, 81% of the total waste generated on campus is non-separated mixed waste, of which 64% is biodegradable waste going to landfill, around 19% is recycled and the remaining is inert waste going to landfill (with zero emissions).
It should be noted that emissions included in the analysis are only related to landfilling, composting, and the recycling of paper and cardboard and plastic. Emissions from recycling of batteries, electronic waste, toners and ink, beverages cans and the inert waste part of the mixed waste (glass, metals and others) were assumed to be insignificant and were not included in the analysis.
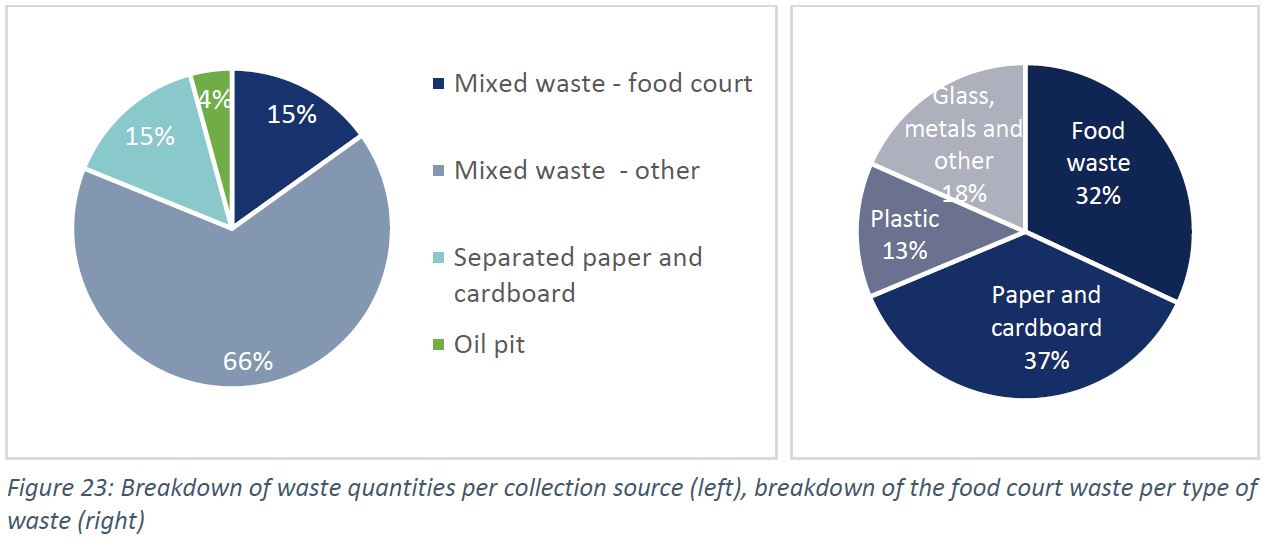
In order to determine the final quantity landfilled, the following stages were applied (see the methodology for further details):
- Waste composition was applied to the mixed waste to determine the fraction of each waste stream (organic, paper, plastic, cardboard, garden waste, etc.):
- Recycling rates were then applied to each collected waste stream that are sorted out from municipal solid waste or separated at the source, in accordance with the recycling rates applicable to the company or waste station site in charge of sending the waste to treatment.
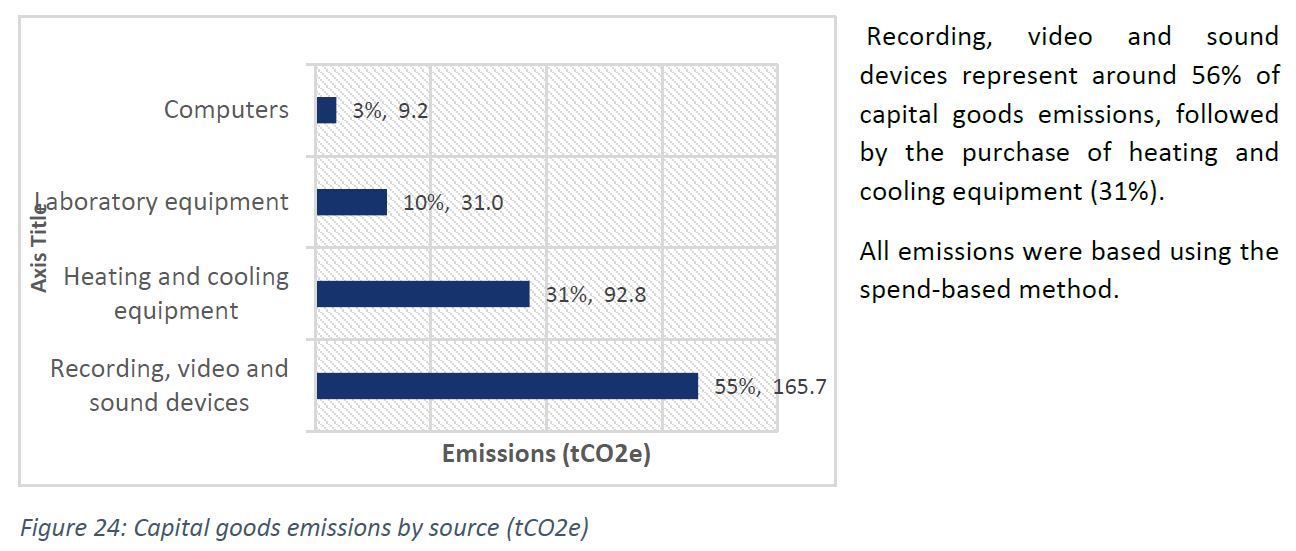
Capital goods
Represent 0.9% of total emissions
Comparison with other universities
Comparability
The carbon footprint of the University of Haifa was compared to other universities based on a study by Helmers et al. (2021), which surveyed available information on the carbon footprint of 21 universities across the world (Helmers, Chang and Dauwels, 2021). It should be noted that carbon footprints cannot be compared across universities on the basis of scopes 1, 2 and 3. For example, large universities sometimes run their own power plants, shifting the emissions related to electricity consumption from scope 2 to scope 1. And each university does not include the same categories in their scope 3, as this scope encompasses a great variety of emissions sources.
Consequently, the comparison was performed on “impact” categories instead of scopes, taking into account those impact categories that were included in the analyses for other universities:
- Energy, which includes emissions related to electricity and heat
- Mobility, which includes emissions related to transport, campus vehicles, staff and student commuting, business trips (domestic and international).
- Further impacts, which include emissions related to fresh and wastewater, office supplies, chemicals and detergents,
Taking into account only these impact categories, the following comparison considered an “adjusted” carbon footprint of the University of Haifa, which totaled 27,326 tCO2e. This means that 83% of the total emissions from the University of Haifa (32,769 tCO2e) were included in the comparability analysis, the rest being out of the scope of the other universities’ carbon footprint analyses.
It should be noted that due to differences in data availability and accuracy for various emissions sources, it is difficult to accurately compare emissions between universities.
Results
Ranking of the University of Haifa
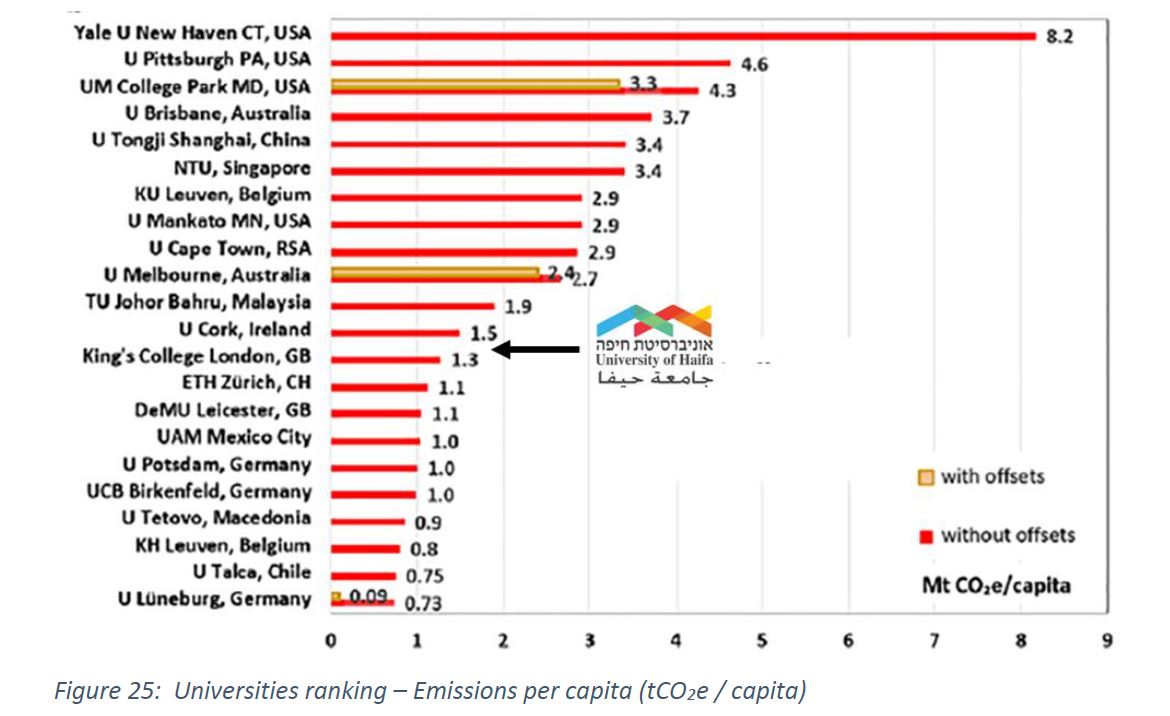
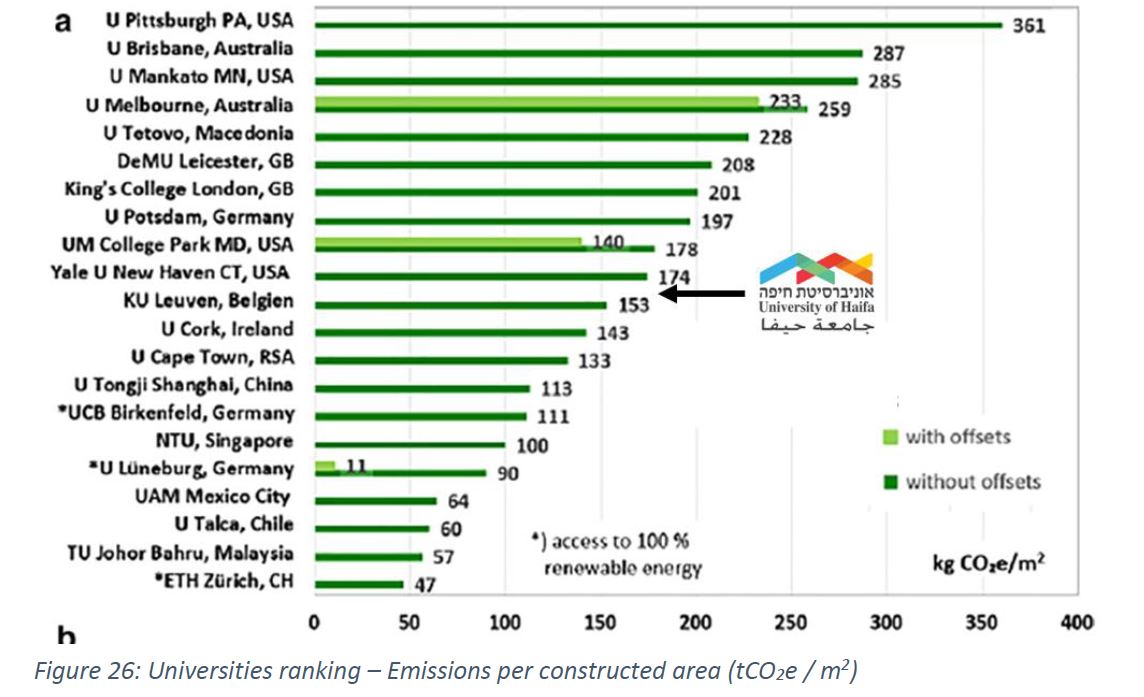
In view of the differences between universities – for example, in terms of number of students and personnel – the comparison between universities was based on the impact categories’ total emissions per constructed area and per capita.
The University’s 2019 emissions – again, adjusted to exclude categories not accounted for by other universities – were 1.4 tCO2e / capita, and 156 kgCO2 / m2.
That ranks the University 11th best when considering the emissions per capita (the University of Haifa emits 90% more than the lowest emissions per capita – which is achieved by the University of Luneburg, Germany), and 12th best when considering the emissions per constructed area (the University of Haifa emits 231% more than the lowest emissions per m2 – which is achieved by the ETH of Zurich, Switzerland).
Distribution patterns of GHG emissions
- Emissions from energy constitute 40% of total emissions, which is slightly below most of the universities included in the comparison (the energy share average of 18 universities10 is around 50%). Three out of the seven universities with an energy share below 36%, benefit from 100% renewable electricity production. Further analysis would be required to understand the reasons behind the low share of energy-related emissions in the other four.
- Emissions from mobility constitute 55% of total emissions, which is in the average range of the other universities (11 universities have a mobility share below 50% while the other 7 are above). Difference between universities can be explained by the location of the campuses (being in the city is limiting somewhat the student and staff commuting distance while shifting more students to public transport).
- Emissions due to waste generation (indicated in “further impacts” which accounts for 5% of total emissions) is in the upper-range of other universities’ value. This might be explained by the fact that the other universities are all located in developed countries where landfilling is not the main waste treatment method, and in some cases is not used at all (indeed, landfilling of mixed waste is prohibited in most European countries).
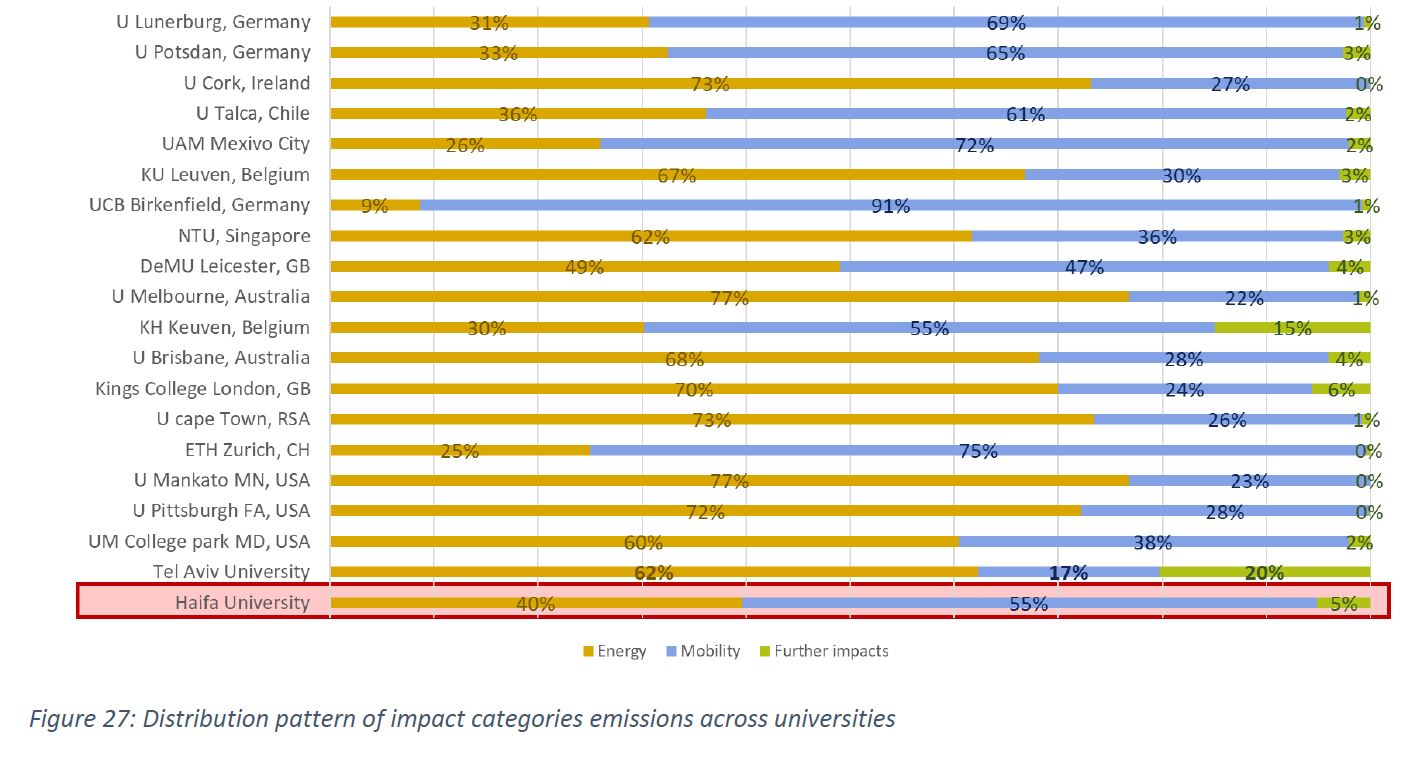
10 Only 18 universities out of the 21 mentioned in the article had detailed information to evaluate their carbon footprint according to the impact categories.
Conclusions
Student and staff commuting was the main emissions source (43.7% of the total), followed by electricity consumption (25%), and purchase of goods and services (10.1%). Fuel consumption and fuel and-energy related activities combined were responsible of 8.4%.
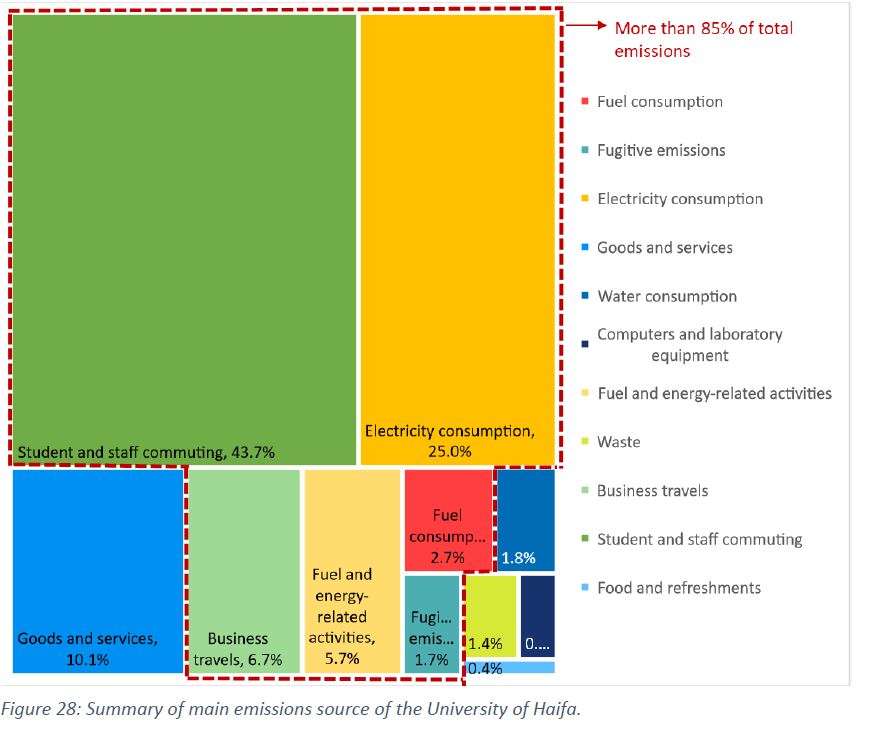
The identification of the main emissions sources provides a basis on which to focus future efforts to reduce GHG emissions. As such, future mitigation measures should deal with those sources that account for more than 85% of the university emissions:
- Measures to optimize and save energy as well as the generation of renewable energy via solar PV or biogas would be essential to reduce electricity consumption and its associated
- Promoting public transportation for students could potentially reduce part of the emissions due to their commuting (80% of student commuting emissions is due to car use). However, further analysis is required to understand better the current breakdown of staff and student means of arrival, as the emissions calculations were based on national average.
- Reduction of international business travels would also impact the total GHG emissions, as it represents 6.7%.
- Measures to reduce direct emissions, due to fuel consumption and fugitive emissions from refrigerants, would impact the total GHG emissions to a lesser extent, as these sources represent only 7% and 1.7% of total emissions, respectively.
- Although the emissions due to the purchase of goods and services is high, they relate to the basic functioning of the University and it would require further sub-categorization and analysis on the data to be able to reduce the emissions related to this category.
Finally, it is worth noting that although the emissions due to the University’s investments were not estimated due to a lack of detailed data availability, the significance of the proposition to divest from high- environmental impact companies should not be overlooked, as it would position the University of Haifa in line with a key global abatement effort. Indeed, divesting has gained momentum in recent years – as of mid-2021, more than 1,300 institutional investors and institutions worth nearly USD 15 trillion had committed to divest partially or fully from fossil fuel-related assets, up 36% from USD 11 trillion in 2019.
Bibliography
CBS (2017) ‘Satellite waste account – Balance of waste streams in Israel, 2017 Findings from the Satellite Waste Account’. Available at: https://www.cbs.gov.il/he/mediarelease/DocLib/2020/413/02_20_413b.pdf.
- CBS (2021) Israel National GHG Inventory 2021 | UNFCCC. Available at: https://unfccc.int/documents/370343 (Accessed: 13 April 2022).
- University of Haifa(2018) ‘Calendar for the 2018/2019 academic year’. Available at: https://www.haifa.ac.il/images/pdf/harshama/eng_academic_Calendar_2018.pdf.
Haim Bleikh (2018) Back and Forth. Commuting for Work in Israel. Based on CBS data. jerusalem: Taub Center.
Helmers, E., Chang, C.C. and Dauwels, J. (2021) ‘Carbon footprinting of universities worldwide: Part I— objective comparison by standardized metrics’, Environmental Sciences Europe, 33(1), p. 30. Available at: https://doi.org/10.1186/s12302-021-00454-6.
Intergovernmental Panel on Climate Change (IPCC). National Greenhouse gas inventories programme. (2006) ‘IPCC Waste Model’. Available at: https://sustainabledevelopment.un.org/content/unosd/documents/4479[08]IPPC.Vol.5.WASTE.Godlove. pdf.
International Civil Aviation Organization (ICAO) (no date) ICAO Carbon Emissions Calculator. Available at: https://www.icao.int/environmental-protection/Carbonoffset/Pages/default.aspx (Accessed: 22 February 2022).
Meron, N., Blass, V. and Thoma, G. (2020) ‘A national-level LCA of a water supply system in a Mediterranean semi-arid climate—Israel as a case study’, The International Journal of Life Cycle Assessment [Preprint], (Issue 6/2020). Available at: https://www.springerprofessional.de/en/a-national- level-lca-of-a-water-supply-system-in-a-mediterranean/17938746 (Accessed: 22 February 2022).
Ministry of Environmental Protection (2014) ‘National Waste Composition Survey. 2012-2013.’ Available at: https://www.gov.il/BlobFolder/reports/waste_composition_survey/he/waste_waste_composition_surve y_2012_2013.pdf.
כלכלה משגשגת בסביבה מקיימת – מסמך חזון משקי ומפת דרכים (2021) Protection Environmental of Ministry at: Available 257. p. ,לשנים 2030-2020
https://www.gov.il/he/Departments/publications/reports/vision_document (Accessed: 24 March 2022).
Ministry of Environmental Protection, EcoTraders Ltd., and Ricardo Energy & Environment (2015) Assessment Of Greenhouse Gas Emission Reduction Potential And Recommended National Target For Israel. Final Report.
The Greenhouse Gas Protocol (2011) Corporate Value Chain (Scope 3) Accounting and Reporting Standard. Supplement to the GHG Protocol Corporate Accounting and Reporting Standard. Available at: https://ghgprotocol.org/standards/scope-3-standard (Accessed: 22 February 2022).
The Greenhouse Gas Protocol (2015) A Corporate Accounting and Reporting Standard. Revised edition.
Available at: https://ghgprotocol.org/corporate-standard (Accessed: 22 February 2022).
United Nations. Framework Convention on Climate Change (2014) ‘Clean Development Mechanism. Tool 15 Methodological tool. Upstream leakage emissions associated with fossil fuel use. Version 02.0’. Available at: https://cdm.unfccc.int/methodologies/PAmethodologies/tools/am-tool-15-v2.0.pdf.
U.S. Environmental Protection Agency (2020) Supply Chain GHG Emission Factors for US Commodities and Industries. Washington, DC, USA. Available at: https://edg.epa.gov/metadata/catalog/search/resource/details.page?uuid=https://doi.org/10.23719/152 4524 (Accessed: 22 February 2022).
US EPA (1997) ‘Volume-To-Weight Conversion Chart’. Available at: https://www.recycleok.org/wp-content/uploads/2012/04/Volume-weight-conversions.pdf.
WRAP (2013) Overview of waste in the hospitality and food service sector. Available at: https://wrap.org.uk/resources/report/overview-waste-hospitality-and-food-service-sector (Accessed: 15 February 2023).
Annex 1. Scope 3 categories’ description